Crypto Academy Week 3 Homework Post for @stream4u by @ghostfacer99


Technical Analysis is very important in trading with proper use of technical charts & other tools, it can help to take important trade decisions.
What Is A Chart Pattern? Explain with Candlestick Charts.
In trading, a bunch of candles forms a chat that shows the price movement of any particular asset. The price movements in the chart pattern can be upwards, downwards, or it can be sidewise.

Generally, charts contain colorful candles which seems messy. Long candle, short candle, green candle, red candle, a candle with a tail or a without a tail. But it depends on the individual who is looking into the chart. If that person is technically sound, they will spot various patterns and signals to place our orders. With a certain knowledge and use of correct charts, timing and tools these can be our great assets to step into any successful trade.
What Is A Price Breakout? Explain with Candlestick Charts and mention the price levels.
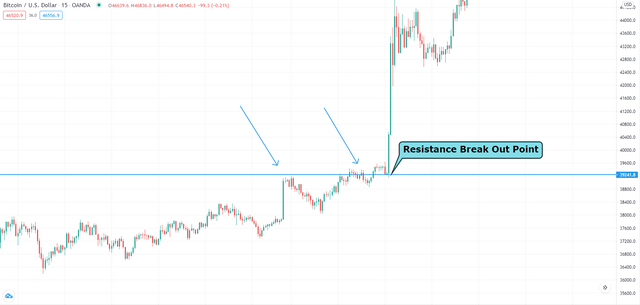 Example of Resistance Break Out
 Example of Support Break Out
As we all know, support is the level from which the price does not seem to go below, and resistance is the level from which the price does not seem to grow. This is called the Price Breakout when this happens. Price Breakout is when any movement of assets goes below its support and exceeds its level of resistance.
These Price Breakout points are very risky. As we don't know how far they will go. These risks also come with a great opportunity for all of us. In this situation, we should take any trade very cautiously with a strict stop loss.
What Is A Continuation Pattern? Explain with Candlestick Charts and mention the price levels.
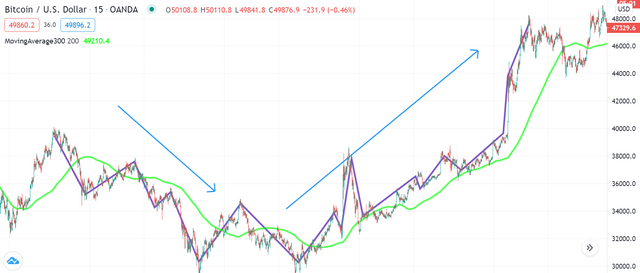
In the Continuation Pattern, the asset appears to be continuing its current trend in the future. If the asset was going up, it's likely to continue its uptrend and go up. If it's going down, it's likely to keep going down. If we can see this indication on the chart, it will allow us to make our investment decisions accordingly.
What Is A Higher High Formation? (Explain with one of the crypto coin charts where the Higher High Formation identified.)
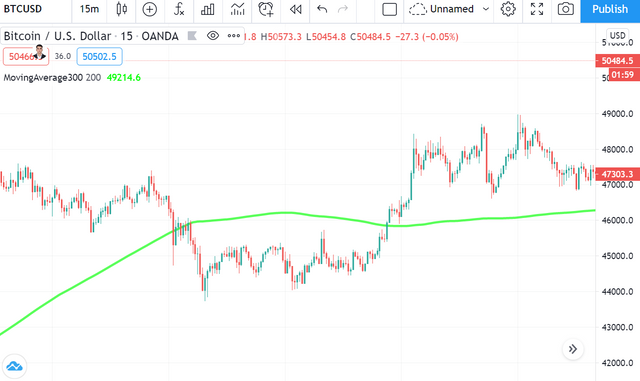
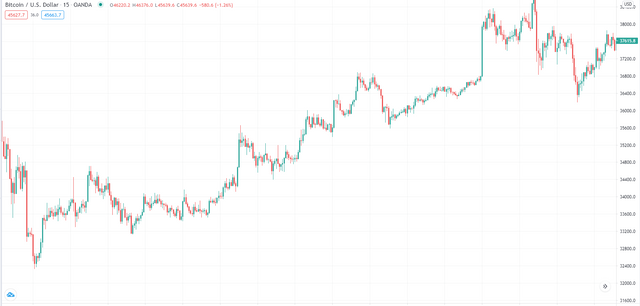
The higher-high trend is the bull run pattern, where investors are persistent and attempt to surpass the last high record and build a new high.
 Example of Higer-High Formation
By drawing a trend line on a chart, we can spot the trend and we have circled the entry points.
What Is A Lower Low Formation? (Explain with one of the crypto coin charts where the Double Top Pattern identified.)
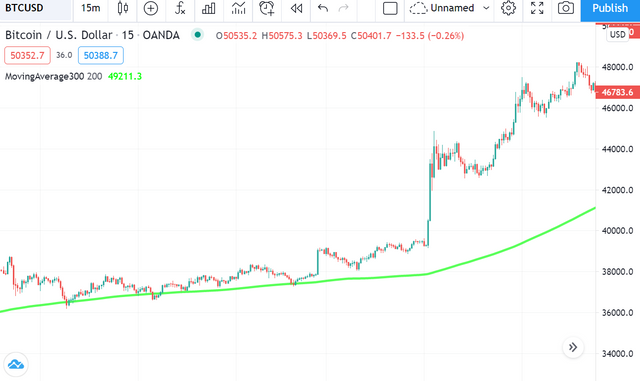
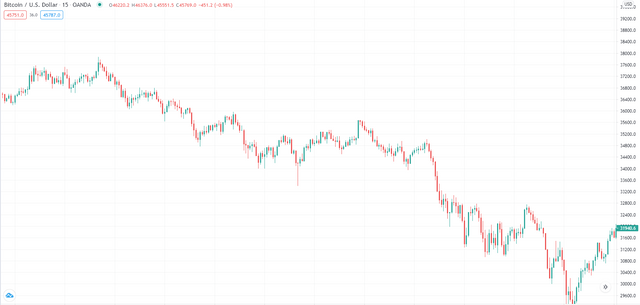
The lower-low trend is the bear run pattern, where investors are persistent and attempt to surpass the last low record and build a new low. When an asset is in a downtrend and it continues to make a new low.
 Example of Lower-Low Formation
As you can see on the screen capture, buyers are exiting the market at the circled points, and sellers are taking charge at the same point & pulled down the price.
What Is A Reversal Pattern?
When an existing trend of any particular asset come to end and it is likely to go reverse, it is called Reversal Patterns.
These patterns form early to indicate the change in the trend and help us to take advantage of the situation. We should enter into any trade with a small stop loss.
 Example of Reversal Pattern
What Is A Double Top Pattern? Explain with one of the crypto coin charts where the Double Top Pattern identified.
The Double Top pattern shows us the 2 high levels on any chart at the same price level. When this pattern is formed, it is likely to go down. This pattern helps us to notice the upcoming reversal patterns when the trend will be changed. If we can spot the double top pattern while trading, it will help us to exit our ongoing trade before the market changes its direction.
 Example Of Double Top
This is an ETHUSD real-time chat in which we see that the double top pattern is formed and the trend is reversed and the price began to go down.
What Is A Double Bottom Pattern? (Explain with one of the crypto coin charts where the Double Bottom Pattern identified.)
The Double Bottom pattern is just opposite to the Double Top Pattern with the 2 low levels on any chart at the same price level. When this pattern is formed, it is likely to go up. This pattern helps us to notice the upcoming reversal patterns when the trend will be changed. If we can spot the Double Bottom pattern while trading, it will allow us to enter into a new trade before the market changes its direction with a small stop-loss.
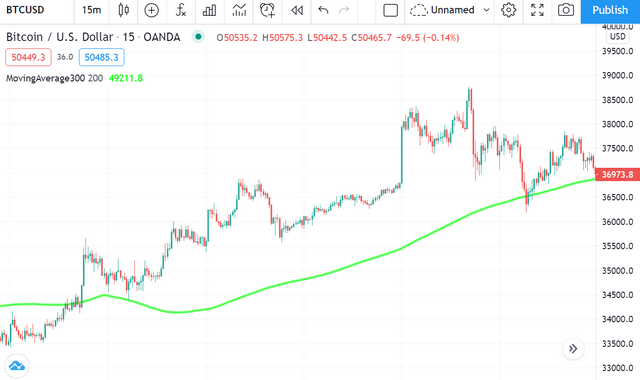
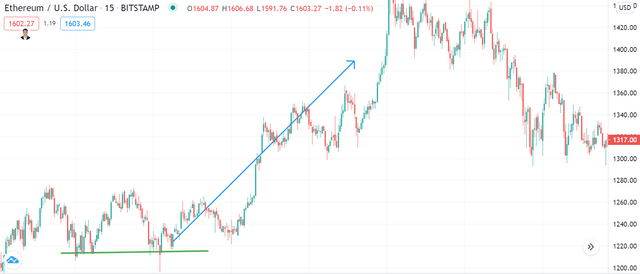 Example of Double BottomFormation
This is a BTCUSD chat in which we see that the double bottom pattern is formed and the trend is reversed and the price began to go up.
In Investing & Trading What Is The Importance of Stop Level(STOPLOSS)?
For all traders, Stop-Loss is also very important. Trading is the game of one's patience & self-control. We've all come to the point where we fail to exit the trade. We feel like the trend is going to change and our losses are going to become profits. With this hope, we end up with an immense loss.
We should always have self-control and always enter a trade only with a stop-loss to prevent such a huge loss.
We can spot our stop-loss point, like every other chart pattern, which we can set for our trade before entering into any trade. Nothing comes with a guarantee, so it is always better to go with the precaution and set a stop-loss on our every trade.
Where To Find & How To Set A Stoploss?
As we just discussed how important is the stop-loss for any trader. To find out any asset stop-loss point, we have to check the history of the asset and look for the previous support levels. Once we have the previous support level, we can decide our stop-loss according to our risk-taking capacity.
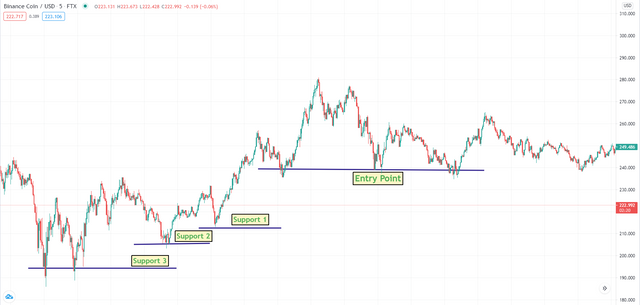 Example of Stoploss
We can follow whatever chart patterns we spot on the chart for our trade. But, we always have to consider the stop loss by checking the previous last 2-3 support level and set the stop loss accordingly.
In conclusion, I feel like patience is the key to be a successful trader and whatever level we have achieved as a trader, we should always trade with a stop-loss. We all know nothing is guaranteed in this world. Keep learning, keep going!!!
At the end of this homework task, I would like to thank @stream4u again for giving his valuable time and making this post to educate us. Awaiting your next lecture post in this series.

Thank you!
@ghostfacer99
Member: Steeming India Community


Hi @ghostfacer99
Thank you for joining Steemit Crypto Academy and participated in the Homework Task 3.
Your Homework task 3 verification has been done by @Stream4u.
Thank You.
@stream4u
Crypto Professors : Steemit Crypto Academy
Thank you!
@ghostfacer99
Member: Steeming India Community