Steemit Crypto Academy | Course 4 By @stream4u | Support <----> Resistance | What is Technical Indicator? | Overview Of TradingView | 200 Moving Average.
Hola amigos ** STEEMTRADERS **
My self @freecreative
This is my 2 participation in 4 conference in #steemitcryptoacademy, #steemit the best social network, I will explain my task and I will try to explain myself clearly and thus help all readers the function.
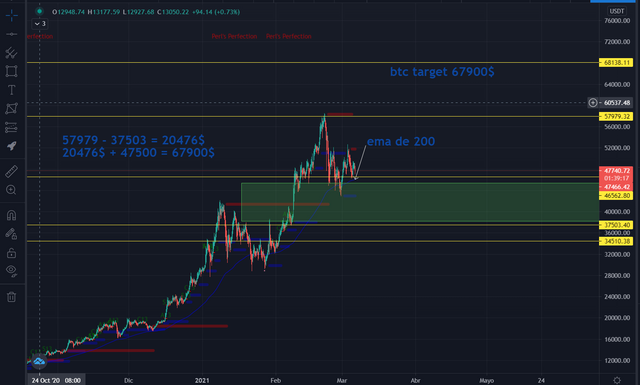
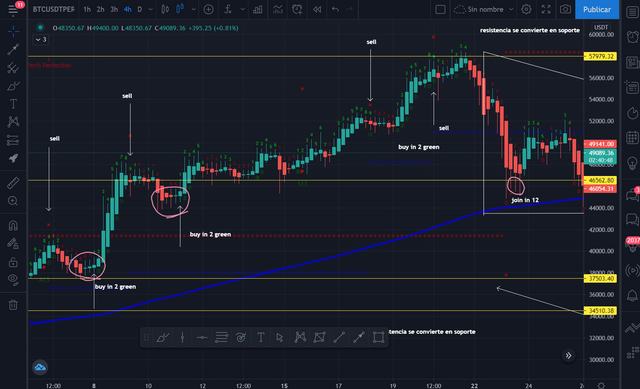
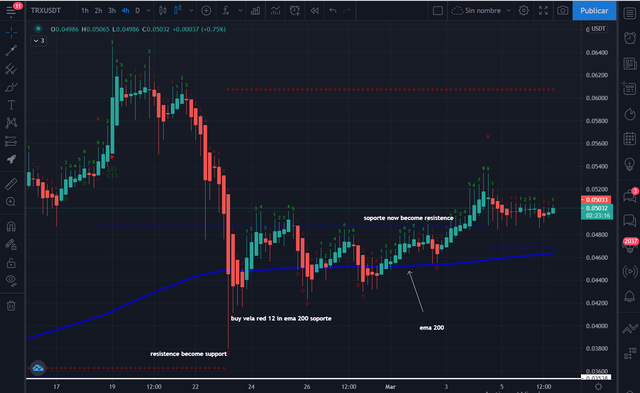
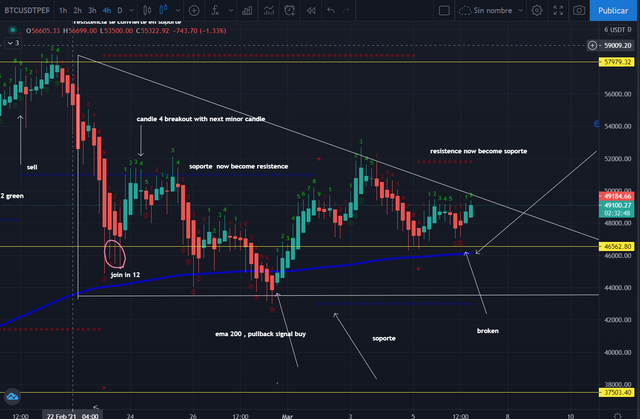
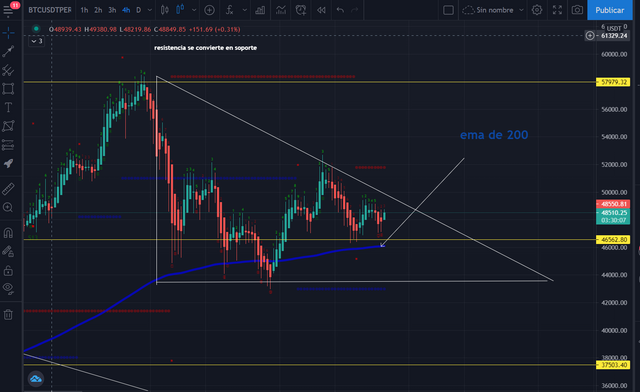
Soporte <----> Resistencia
Cómo el soporte puede convertirse en resistencia y la resistencia se convierte en soporte.
The supports are created in the liquidity levels in the market, the accumulation is given by the offer but a price action is needed to be able to take a trend.
The Price supports are walls of monetary liquidity, each one of them is present to satisfy the selling action in the market.
This normally occurs in all markets, the price will always seek liquidity, if it is easier to go down because there is money below then the price will go towards liquidity.
If the supply is large and the liquidity is equal or even higher then the price will rise, it must be remembered that there is a shortage.
The price will seek that resistance until it reaches a maximum equilibrium point between the 2 trends, that is when the price will be satisfied and will rise more because there is more liquidity above.
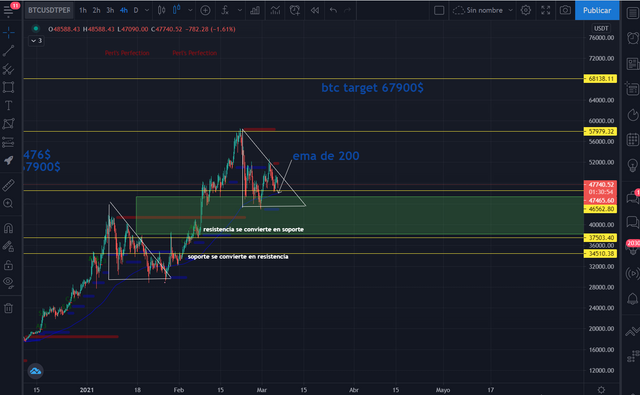
Example Of 200 Moving Average.
Homework Task(Topic 2): What Ia A Technical Indicator & What They Do?
Tom Demark
The Tom DeMark Sequential is an indicator that is not widely used. It can be said that the TD Sequential is a numerology technique.
TD Sequentia this indicator has a fibonacci projection and gives amazing hits.
- To specify and wait for exact moments in supports and resistances of the markets. In addition, it can also be used effectively by viewing the supply and demand in the degrees of its numbers from 1 to 9 ... 13 in any period but to be more exact in 4h, 1D week or month.
I recommend: Heikin ashi candles
TD Sequential combined with harmonic patterns helps to find exactly the ZPI when a sale loses strength, it can be calculated depending on the number of candle a next sequence, giving exact signals of when to enter the market or when to close a current exchange when seeing a 9 with a scalpng in 15 min to 1h.
Tom Demark in the market
When the TD Setup has been completed, the market will be entered following one of the 3 ways created by Tom DeMark with risk control on danger and big profit.
Enter shortly after the beginning assertion. It is related to the opening of the activity after the end of the 13th candle that ends the beginning.
Al tener una gran variedad de indicadores todos viene de una misma premisa, la suma del promedio pasado con la suma del predio presente para asi darte un promedio futuro.
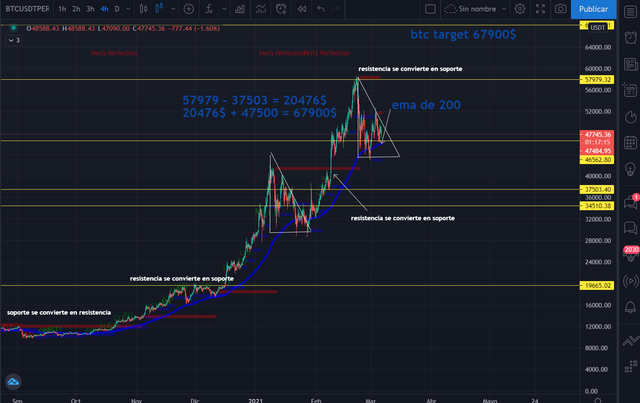
When we see the corrections, we can add these fibonacci retracements with the supports and thus have a price projection triangulated in the Pythagorean style where we look for the hypotenuse and the sum of the legs.
A+ B = C
The moving averages are thus characterized by periods an exponential line of precision is the EMA 200
"TradingView"
In trading view we can find an important variety of indicators but given the great volatility of the BITCOIN and cryptocurrencies market, they cannot be trusted 100%; It is Relative we know that we are in a manipulated and underdeveloped market
"200 Moving Average"
The exponential average of 200 works as a support or as a resistance, if the price crosses such a line the price tends to follow strongly, even so it is not all the cases.
Now we will learn about Technical Indicators.
Big traders have made a lot of money just by using the 200 ema.
In this task I explain tradingview.
| Homework Task(Topic 3): Provide your view and explore TradingView. |
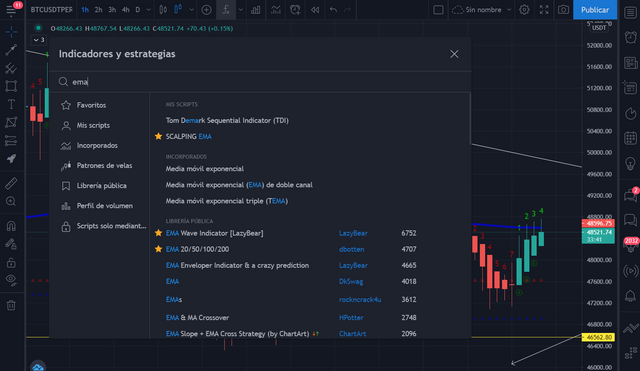
What Is TradingView?
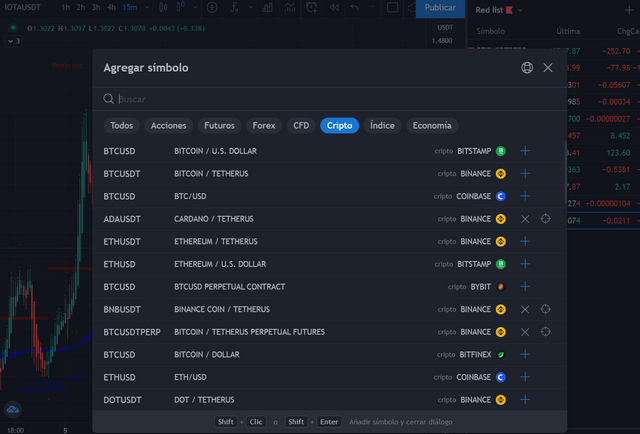
It is a market and statistics platform that gives us a series of tools to be able to analyze the economic markets, there are other platforms apart from tradingview such as https://www.gocharting.com
If you want you can use Paper Trading to practice without having to use real money
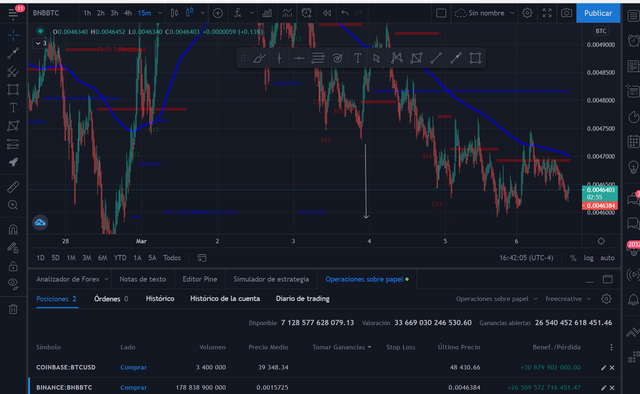
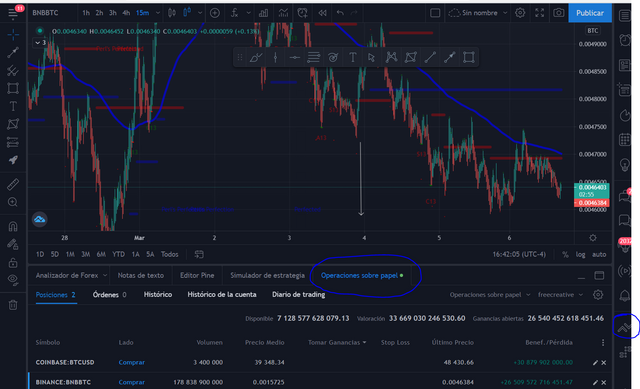
Hagan clic donde están los círculos azules y podrán usar el paper trading
INFO
- IMPORTANT:- All homework posts should be posted in the community [Steemit Crypto Academy]
What was understood from this course? / Conclution.
The accumulation, trend and distribution are presented as patterns in all projects, their price is relative thanks to their market capital, the entire trading process.
never risk more than you are willing to lose.
@stream4u Master, thank you that I found it
#crypto200 #stream4u-week4
#Acknowledgments
Leadership
@steemcurator01 ADMIN
@steemcurator02 MOD
@steemcurator03
@steemcurator04
@steemcurator05
@steemcurator06
Hi @freecreative
Thank you for joining Steemit Crypto Academy and participated in the Homework Task 4.
Your Homework task 4 verification has been done by @Stream4u.
Thank You.
@stream4u
Crypto Professors : Steemit Crypto Academy
I'm going to read the master again, I'll translate your post in my language, I hope to edit it, thanks
done, place the labels of the week and one more explanation thanks @stream4u
PD: I have to read more the post in English and practice
tambien agregue la parte de indicadores explicando tom de mark
Thank You, "What Ia A Technical Indicator & What They Do?", this is just to explain the basic information about the Technical Indicator and not specific to any Indicator, but you explain specific indicator "tom de mark. "
Secondly, I see you mentioned about TradingView, after that 200 MA then again I see TradingView. Below is how I see it.
Also, the given information on each topic looks short. So, looking at the overall post, still I feel the provided review is okay for this task. The Homework task 4 verification has been done.
Thank You.
@stream4u
Crypto Professors : Steemit Crypto Academy