Introduction
It's another great time to be back again at the academy
to learn from our professors, attended a few lectures earlier this week and they are
great ones and this time, I proceeded to attend the lecture presented by professor
@stream4u where the professor taught the topic
Technical Indicator: Pivot
Points. I will solving the task given by the professor with this piece of
article.
1. Discussed your understanding of Pivot Points. (Title For this topic will be Pivot Points)
Pivot Points
Pivot points is yet another technical indicator used for
technical analysis on chart pattern to measure the price behavior of an asset over
time. This technical indicator detects the previous highs, lows and closing price in
the previous trend of the asset to enable the analyst carry out analysis on the next
move considering the resistances and supports marked out by the
Pivot Points.
By using Pivot Points, it ease the stress of checking on
the price behavior of an asset over time which are often done by drawing lines of
resistances and supports which can now be easily seen using the technical indicator
"Pivot Point". The previous highs (Resistances), lows (Supports) and close levels allow the analyst to easily project the next price behavior of the asset for the purpose of trading/investment.
The resistances as marked out by the Pivot Points can
be utilized by an analyst as the Take profit levels and the supports to gain
an insight into when it would be better to Enter/Exit a trade also equipped with
effective stop loss as seen in different lows. It's an effective technical indicator for intraday trading as the levels are unchanged throughout the day.

2. Details about Pivot Point Levels
Pivot Points Levels
From the measure of the previous price
behavior of an asset on a chart pattern, the technical indicator, Pivot Points shows
different highs, lows, and close levels which are represented in levels, that is, a
resistance where there was price breakout to attain another high creating another
resistance line or a support where there was price breakout to drop to another low
thereby creating another support. The Pivot Point levels are; Main Pivot Point
(PP), Support 1 (S1), Support 2 (S2), Support (S3), Resistance 1 (R1), Resistance 2
(R2) and Resistance 3 (R3). Let's talk about each levels below.
Main Pivot Point (PP): This level represents
the middle and the main pivot point on the chart being explored. This level
considers the summation of (daily high + daily low + closing price) divided by 3 to
establish the main pivot point (PP).
Support 1 (S1): This represents the first pivot
level below the main pivot point on the chart being explored and also represents
when the point at which the price of the asset is triggered to move uptrend again after a brief trend reversal from the main pivot point creating Support 1 (S1) below the main pivot
point (PP).
Support 2 (S2): This represents the second
pivot level below the main pivot point and Support 1 (S1) on a chart being
explored. This also represents the point of another support after a price breakout at
S1 that broke the support to create another support on the chart which is Support 2
(S2) below the main pivot point (PP) and Support 1 (S1).
Support 3 (S3): This represents the third pivot
level below the main pivot point and Support 2 (S2) on a chart being explored. If
there is another price breakout at the Support 2 (S2) that broke the support, then this
level S3 is created below the main pivot point (PP) and Support 2 (S2).
Resistance 1 (R1): This represents the first
pivot level above the main pivot point on a chart being explored. In an uptrend
market, an uptrend from the main pivot point leads to another high, which
creates Resistance 1 (R1) above the main pivot point (PP).
Resistance 2 (R2): This represents the second
pivot level above the main pivot point and Resistance 1 (R1) on a chart being
explored. If the market goes more bullish such that there was another price
breakout at Resistance 1 then it opens another high to form Resistance 2 (R2)
above the main pivot point (PP) and Resistance 1 (R1).
Resistance 3 (R3): This represents the third
pivot level above the main pivot point and Resistance 2 (R3) on a chart being
explored. Further price breakout at Resistance 2 in a bullish market (Uptrend)
creates another high which is taken as Resistance 3 (R3) above the main pivot
point (PP) and Resistance 2 (R2).
3. Pivot Point Calculation and R1 R2 S1 S2 Pivot Levels Calculation.
Pivot Point Calculation
Assuming;
PP = Main Pivot Point (Summation of Daily high and Daily Low and Closing price)/3,
D.high = Daily High (Highest price of an asset attained from the previous day),
D.low = Daily Low (Lowest price of an asset reached from the previous day),
C.price = Closing Price (The closing price of an asset from the previous day),
Therefore:
Main Pivot Point is calculated through the expression--- (D.high+ D.low +C.price)/3
R1 R2 S1 S2 Pivot Levels Calculation
Where;
PP = Pivot Point (Summation of Daily high and Daily Low and Closing price)/3,
D.high = Daily High (Highest price of an asset attained from the previous day),
D.low = Daily Low (Lowest price of an asset reached from the previous day),
C.price = Closing Price (The closing price of an asset from the previous day),
Therefore;
Resistance 1 (R1) = 2 × PP - D.low
Resistance 2 (R2) = PP + D.high - D.low
Support 1 (S1) = 2 × PP - D.high
Support 2 (S2) = PP - D.high - D.low
4. How to Apply Pivot Point on Chart. (Screenshot with tag your name)
Using the TradingView chart, I will be setting up the Pivot Points technical on the chart. The steps involved are listed below;
- Visit tradingview.com/ and navigate to the chart.
- Click on the Indicator and strategies function at the top of the page.
- Search for Pivot Points in the search field and click on Pivot Point Standard.
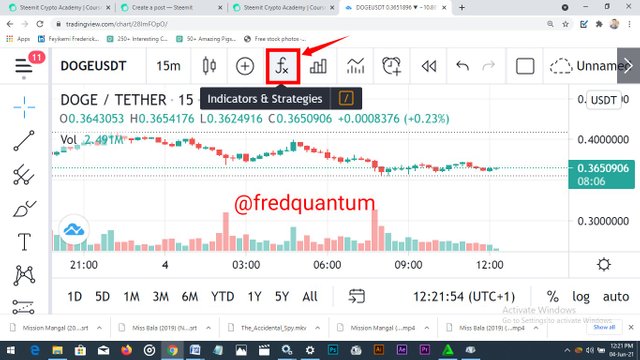
Select Indicators function
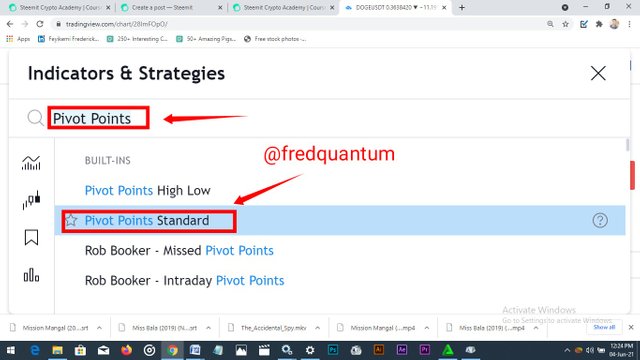
Search for Pivot Points and Select
Pivot Points indicator established
Now that I have the Pivot Points established on my Chart, it's time for configuration.
Click on Settings on the Pivot Points indicator on the chart.
On the settings window, choose the Inputs function to effect it to desired. Options on the Inputs are Type; we have Traditional, Fibonacci, Woodie, Classic and so on, Time-Frame; Auto, Daily, Weekly, and so on, and Number of Pivot Back set to desired input, 15 is the default and click OK to effect settings.
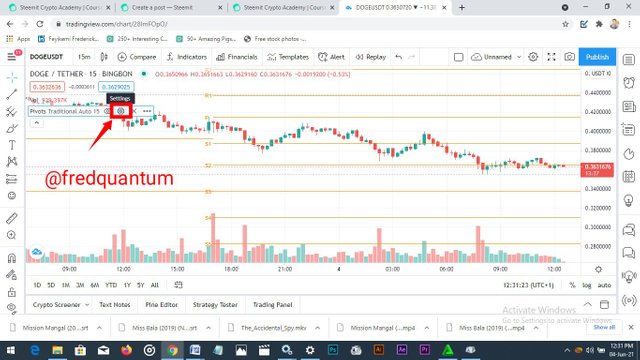
Select Settings
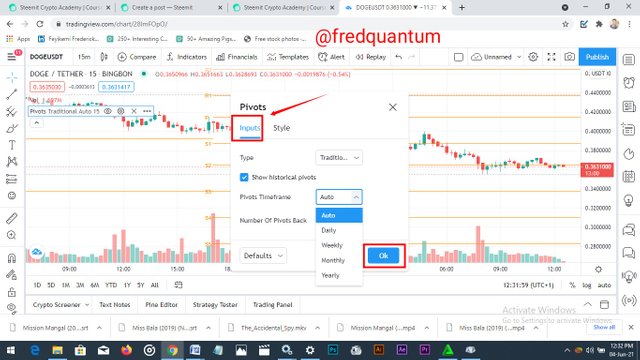
Settings- Inputs
- From settings again, switch to Style and make configuration to desired parameters. Some of the available sections are; Labels Font; To change font type and size, Colour of Levels; To customize the colour of the levels to desired. Click OK to effect the change.
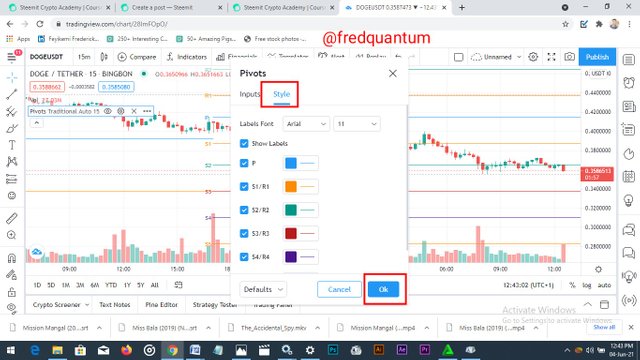
Settings- Style
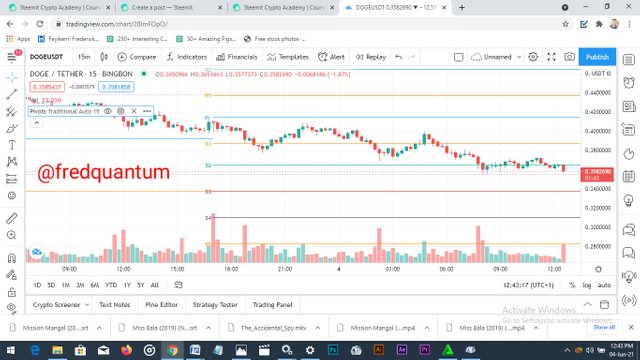
Pivot points Indicator changes effected
5. How Pivot Points Work. (Screenshot with tag your name)
From the knowledge of Pivot Points indicator as I've
explained earlier at the beginning of this article, the indicator shows the trend of a
particular market on the chart which starts from the Main Pivot Point (PP)
which further create series of highs, lows and closing price for a day which can be
utilized as resistances and supports for the next day. This indicator allow traders to
see the resistances and supports for making trading decisions. Let's take a look at
the screenshot of STEEM/BTC market below. Note- On 15mins time-frame.
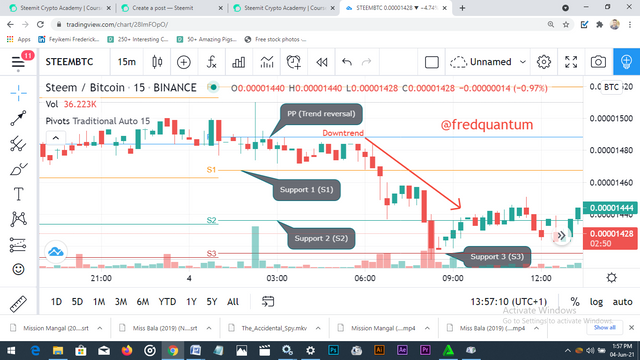.png)
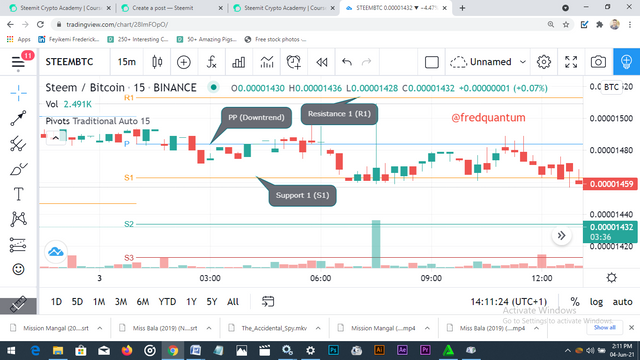
Trend reversal at PP- STEEM/BTC
From the above screenshot, the main pivot point (PP)
calculated from the summation of the previous day (Daily high + Daily low +
Closing price)/3, there was a trend reversal (downtrend) at that point to create Support 1 (S1)
below the main pivot point, there was a breakout of price in downtrend movement
which led to the creation of another pivot level, Support 2 (S2) and up to Support 3
(S3) all below the main pivot point (PP). Let's proceed.
.png)
Trend reversal after Support 1 (S1) to open Resistance 1 (R2)
From the screenshot above, at the main pivot point (PP)
the market goes downtrend and a new support (Support 1) was created below the
main pivot point, at Support 1 (S1), there was a trend reversal which has the price
of the asset closing at a point above the main pivot point to create Resistance
(R1).
Basically, the trend of an asset is determined at the main pivot point (PP) and further create resistances (R1,R2, R3...) above the main pivot point and supports (S1,S2,S3...) below the main pivot point. The resistance and support created are taken from highs and lows price behaviour of the asset
from tye previous day.
6. Pivot Point Reverse Trading. (Screenshot with tag your name)
Reverse strategy is a good strategy that can be used by
traders/investors to take advantage of both the bearish and bullish market, as such,
Pivot points reverse trading strategy can be used on a chart to take advantage of
different trends in an asset's market using the pivot levels (PP, S1, S2, R1, R2...) for
entry/exit in a market. Let's see some examples below.
.png)
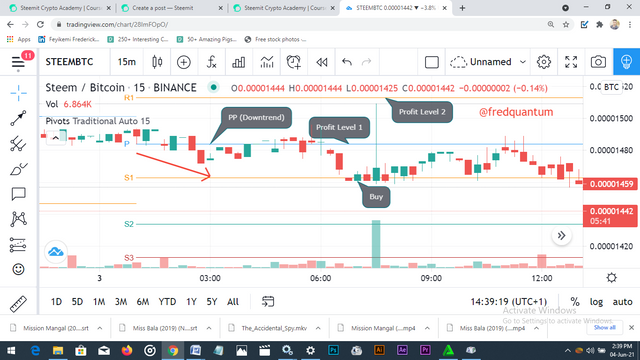
STEEM/BTC- Pivot Points reverse trading 1
On the 15 mins time-frame of the STEEM/BTC chart
above, from the main pivot point (PP), the trend of the asset goes bearish and this
puts traders on an alert of entering the market. Traders can utilize a period like this
to enter a trade as such, below the main pivot point, a pivot level surfaced which is
Support 1 (S1) and this is a good position to enter the trade. At Support 1, the trend was reversed (uptrend) and as such, a trader can consider taking the first profit at the main pivot point (PP) and the second take profit level at the R1 which was created above the main pivot point.
.png)
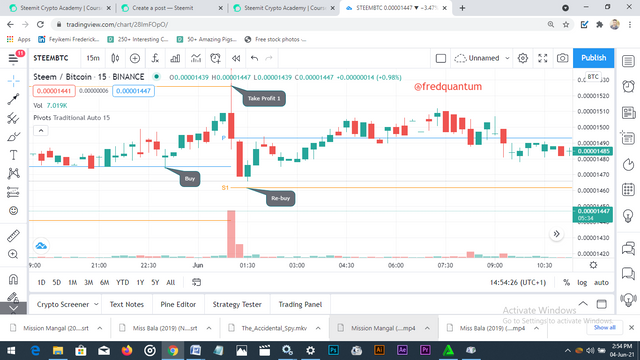
STEEM/BTC- Pivot Points reverse trading strategy 2
As seen from the above screenshot, considering buying
the asset from the previous day main pivot point (PP), the market goes
uptrend before a pivot level (R1) was created above PP which is
a perfect take profit 1 before a downtrend was seen, the user can wait to
re-buy the asset at the S1 below the new day PP and set another
profit level to the PP and R1. With this, the trader can enter the
market multiple times and take profits for himself/herself.
7. What could be a common Mistakes in Trading with Pivot Points
Just like every other technical indicators, Pivot points is liable to give false support or resistance through the pivot levels. Some of which will be discussed below.
In an extremely bearish trend of an asset, the pivot level S1 might show up just below the main pivot point PP which might be broken just after one bar and continues in a bearish trend, if the trader isn't patient enough to confirm if that is truly a support and entered the trade then it could lead to loss or waiting longer for the asset to bring back his/her capital and probably some profits.
Also, in an extremely bullish market and with a pivot level maybe R1 shown above the main pivot point PP, without waiting for a confirmation of a trend reversal, a trader might sell off his/her asset and such asset continues in uptrend direction breaking the R1. If greediness set in for the trader, he might buy the asset again at a high price with tendency that the asset will go bearish and such isn't good for the trader that just bought it again at a high price.
There are series of trend reversal under pivot level S1 S2... that can be used to enter the trade multiple times, since resistance are shown above the main pivot point, a user might deprived themselves of making some profits because they are waiting for a break above the main pivot point PP, as such, basic knowledge of support and resistance should be applied to maximize one's profit chances.
8. What could be the reasons For Pivot Points is Good.(Pros/Advantages)
With no doubt, there are many advantages attached to the pivot points indicator use and some of which will be discussed below.
It is very useful for traders to make intraday trades as the high, low and closing price of an asset is revealed and this allow users to have an idea of what has happened in the market the previous day to making a good trading/investment decision.
Traders/Investors don't need to go through the stress of drawing out resistance and support lines, the use of pivot points shows different levels which can be easily used by a trader to set Take profit levels and effective stop-loss at one of the lows of pivot levels.
Also, it can be utilized for long-term trading purpose since the levels don't change during the day and the calculation of the pivot levels can be done easily by the traders as they are calculated through simple expressions that consists of High, low and closing price of an asset.
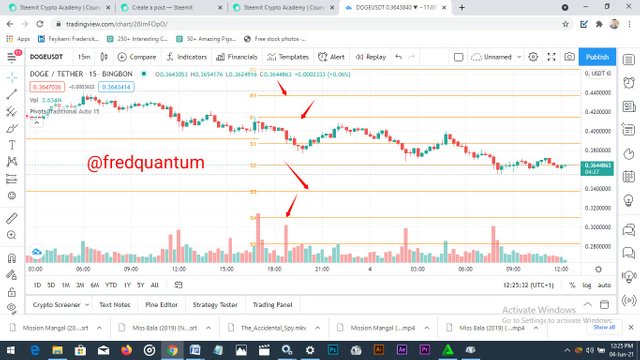
9. Apply the Pivot Points indicator in the Today chart (the day when you making this task) and set the chart for 15 minutes. Explain the market trend till the time of writing the task and how it will be next till the end of the day. You can give possibilities on both the side bearish and bullish.
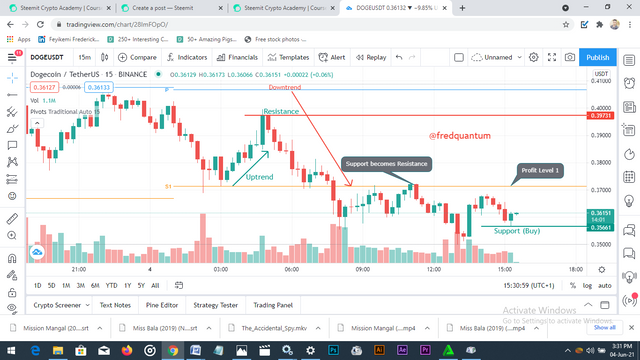
For this aspect of the task, I will be analysis the DOGE/USDT on a 15 mins time-frame chart to see the price behaviour of the asset over time using the pivot points indicator.
.png)
DOGE/USDT- Chart 1
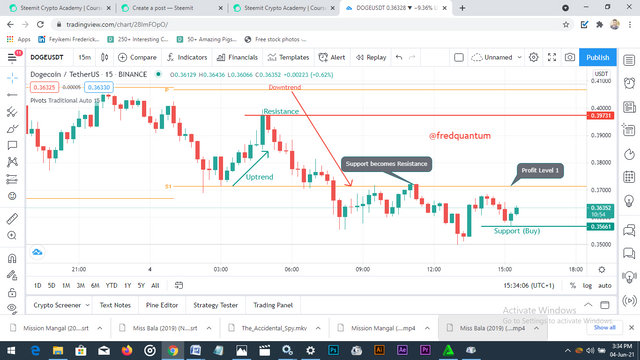
The main pivot point (PP) opened the price of the asset for the day and we have around 0.41 USDT which moved in downtrend position, the bearish persisted for a while before a pivot level Support 1 (S1) was created below the PP around 0.37 USDT, a trend reversal occurred at that support and the market goes uptrend before facing a resistance around 0.39 USDT. Let's proceed to the next chart.
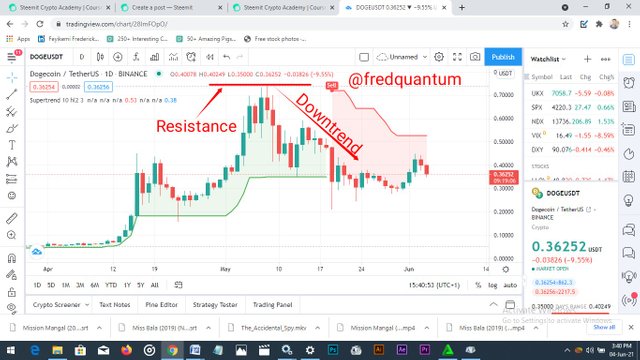
.png)
DOGE/USDT- Chart 2
From the above, the S1 pivot level was broken and the trend continued in the bearish direction. There are series of trend reversal in the process until a point when the S1 becomes a Resistance at 0.37 USDT, the market continued in the bearish trend. Now the asset had a support at 0.356 USDT and it's going uptrend.
My conclusion on this, at the end of today, I expect the price of the asset to continue in the uptrend direction having the first take profit level to be the S1 and if there is likelihood of a price breakout at S1, set my second profit level at a resistance seen at 0.39 USDT. Likewise, if the support of purchase was broken then we can see the asset hit a low of 0.35 USDT at the end of today.
10. Weekly Price Forcast For Crypto Coin: DOGE/USDT
Basic Information about DOGE
Talking briefly about DOGECOIN history, it is an open-source cryptocurrency created in the year 2013 by Jackson Palmer and Billy Markus with the aim to make it serve as an alternative coin to Bitcoin and of course, it's an Altcoin that all started as a meme with the name taken from a of breed dog. A few years later, it turned out to be adopted by many in the crypto ecosystem and has its value risen. DOGECOIN uses the consensus algorithm Proof of Work (PoW) where miners does the work of transactions validation and securing the network by solving computational equations.
DOGE brief data
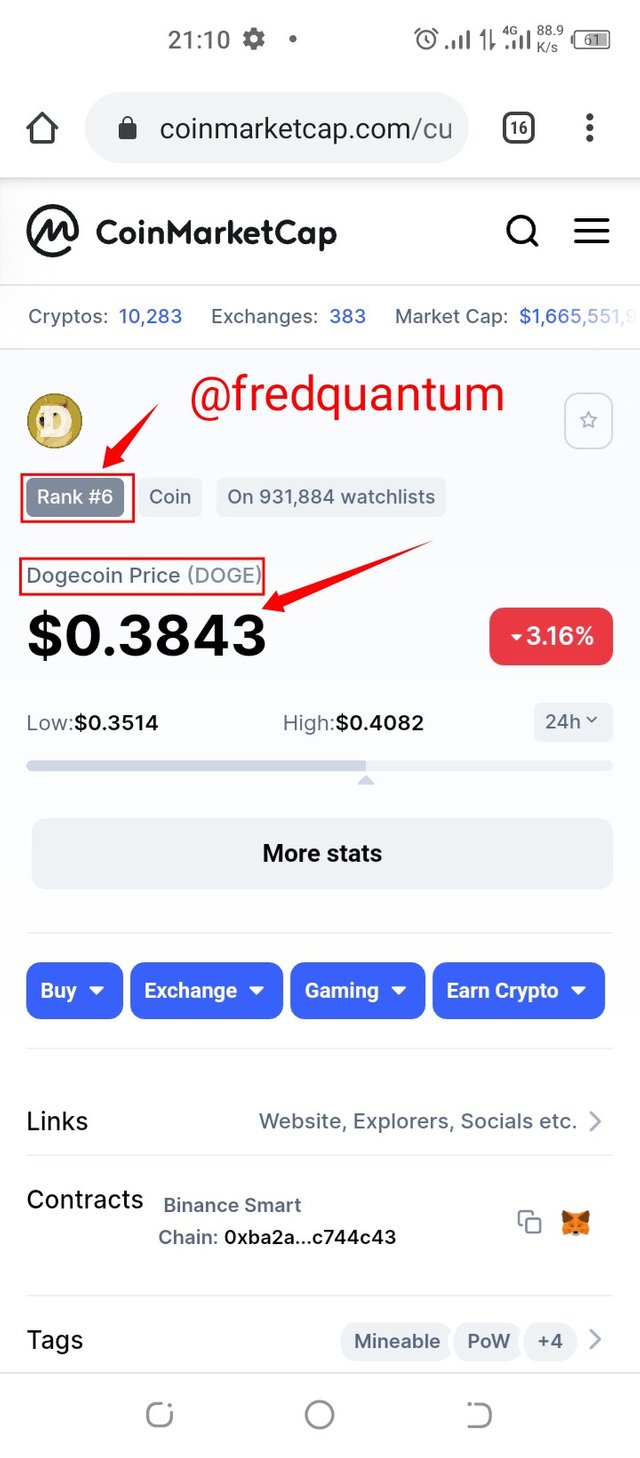
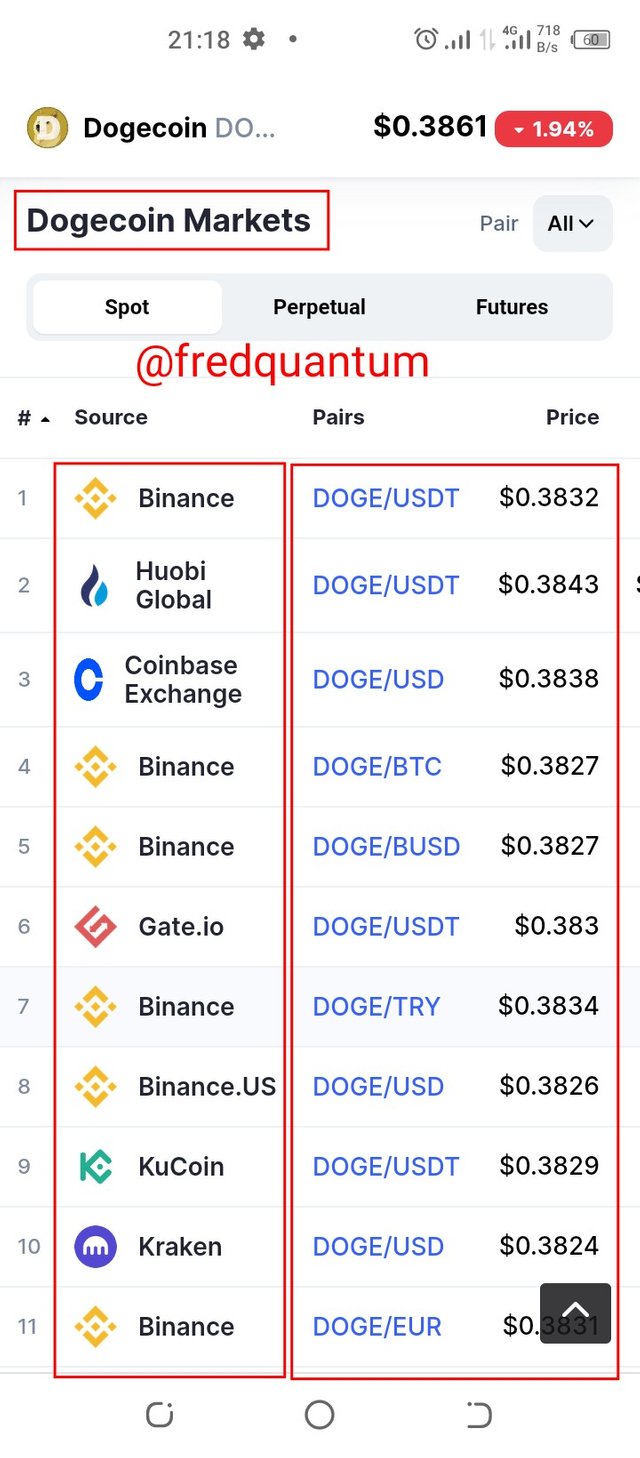
DOGE is currently trading around 0.3828 USD taking up the 6th ranking with market capitalization of 49,912,184,228 USD and circulating supply of 129,881,831,420 DOGE with this value also representing its total supply at the moment. Considering liquidity, the DOGE crypto has high liquidity as it's been listed on many exchanges that has it on their Spot and Perpetual trading platform, some of the exchanges are as follow; Binance, KuCoin, Kraken, Binance.US, Huobi Global, Coinbase exchange, Gate.io and many others.
Reason for Choosing DOGE
When we talk about cryptocurrencies that has enjoyed massive growth in the previous months, DOGE is one of them having received support from notable people in the society , people like Elon Musk, the CEO of Tesla who was also acknowledged as a massive mover of the Bitcoin market after he announced Tesla would accept Bitcoin for purchase of vehicle.
One of the reasons I am in the crypto ecosystem is to take profit from market comfortable, as such I see the DOGE as a crypto with good potentials to give reasonable return on investment either in a long term or short term. I HODL some DOGE and it interests me to see more about it which would prompt me to carry out technical analysis on it as well.
Technical Analysis of DOGE- Prediction for the next 1 week
Exploring the chart pattern of DOGE/USDT on TradingView, I will be combining the SuperTrend indicator which appears to be my favourite indicator recently but I won't rely on that, I will mark several positions to see the price behaviour of the asset over time and project its next move. Let's get to work.
DOGE/USDT- 1 Day time-frame
From the 1 day time-frame on the chart of DOGE/USDT, it is seen that the asset enjoyed massive uptrend a few days to May 2021 that made it attained an all-time-high of 0.74 USDT. Shortly after attaining that, there was an extreme trend reversal (downtrend), so looking at the 1 Day time-frame chart, it is evident that the asset is in a downtrend position.
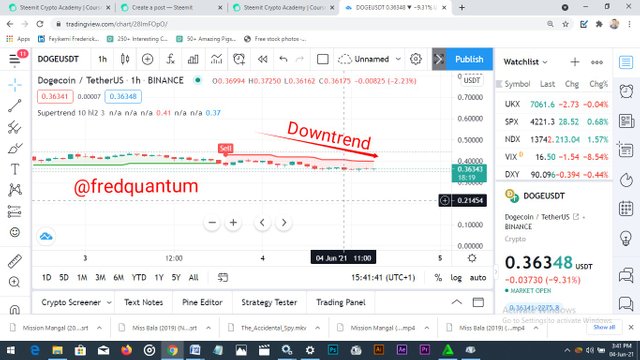
DOGE/USDT- 1 hr time-frame
The above is the DOGE/USDT on an hour time-frame and nothing much is noticed than an evidence that on a 1 hr time-frame, the asset is in downtrend direction. And now, let's take a look at the 4 hr time-frame chart.
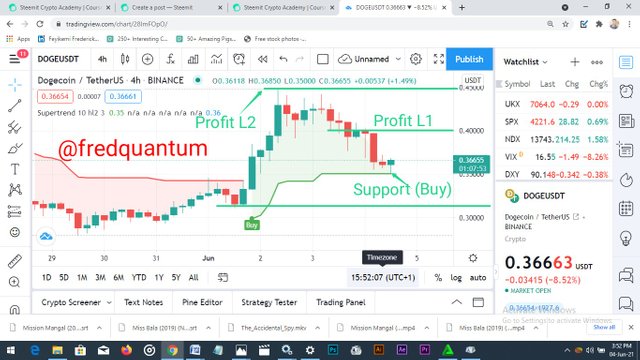
DOGE/USDT- 4 hr time-frame
There are so many points marked out on this chart above, it was on a downtrend at the moment I was exploring the chart, a support was created just at the Supertrend indicator's support which opened a position for purchase at 0.35 USDT and there was a trend reversal as the asset moved in the Uptrend direction. Considering the previous high, I marked a first profit level at 0.4 USDT in preparation for the next one week, provided there was a price breakout at 0.4 USDT, we can be looking at attaining the all-time again thereby marking my second profit level to be 0.74 USDT.
If there was a trend reversal at the first profit level, then we can see the asset coming down to the support 0.35 USDT, if they support breaks then the asset would reach a low of 0.315 USDT as marked out on the chart. Also, if the price breakout up to 0.74 USDT then experience a trend reversal, the 0.35 USDT low should considered for Stop-Loss.
Technical Analysis Summary
For the next one week, I expect to see the asset reach 0.4 USDT which is my first profit level and if there is a price breakout at the resistance, then we can be looking at 0.74 USDT as my second profit level, for this breakout, I put my stop loss at the support 0.35 USDT. Looking at the bearish side, if there is a trend reversal at the first profit level then we can see the asset hitting the low 0.315 USDT.
Conclusion
In conclusion, the pivot points indicator ease off the stress of drawing out support and resistance lines as setting the indicator on the chart have pivot levels drawn revealing highs, lows and closing price that users can utilize for making trade decisions. It is effective for intraday trading and benefits long-term traders as well with the pivot levels available all-day without changing, care must be taken when using this indicator as to be on a safe side of investment, remember, technical indicators gives false signals some times. Thanks to professor
@stream4u for this awesome lecture. Thank you, all.
Cc: @stream4u
Written by;
@fredquantum


.png)
.png)
.png)
.png)
.png)
.png)


Hi @fredquantum
Thank you for joining The Steemit Crypto Academy Courses and participated in the Homework Task.
Your Homework Task verification has been done by @Stream4u, hope you have enjoyed and learned something new.
Thank You.
@stream4u
Crypto Professors : Steemit Crypto Academy
#affable
Thanks for the review professor @stream4u. I'm glad to participate in this lecture. Thank you, sir.