Crypto Academy / Season 3 / Week 8 - Homework Post for [Crypto Professor @cryptokraze]


1 - What is your understanding of Sharkfin Patterns. Give Examples (Clear Charts Needed)
Sharkfin Patterns is the rapid change in direction in a market be it in an uptrend or downtrend movement. The partner is very significant when the reverse trend occurred and creates a V pattern or inverted V pattern in the market. When we have the inverted V, that means it occurred in an uptrend market, and when we are in a downtrend the V pattern is formed. For this pattern to occur in any of the trend markets movement, the market price needs to be rapid and equal in both directions. That is why you can notice the V pattern or the inverted V pattern in the market.
Example Uptrend Market
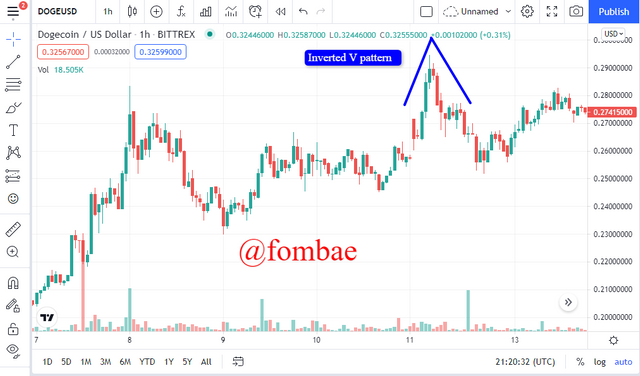 DOGE/USD chart above on 1h time frame (Sharkfin inverted V pattern)
Example Downtrend Market
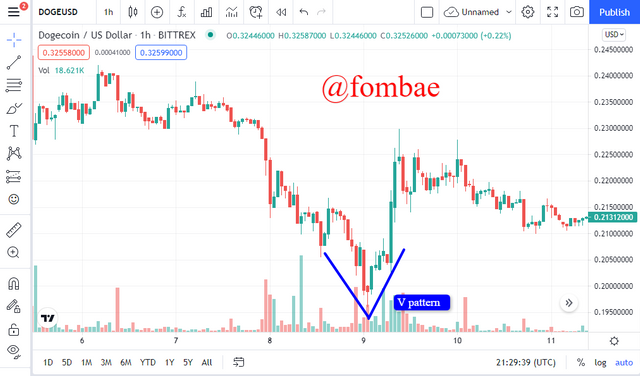 DOGE/USD chart above on 1h time frame (Sharkfin V pattern)
This examples above you can clearly see what is call Sharkfin pattern as a quick reverse in direction is created along the price movement. Note for such a pattern to be created, they most be a rapid movement and change in direction.
2 - Implement RSI indicator to spot sharkfin patterns. (Clear Charts Needed)
RSI indicator is one of the most popular indicators used by traders on a market chart. RSI is the acronym for Relative Strength Index, which a trader can use to spot out a Sharkfin pattern in a market.
RSi has an oscillation range of 30 and 70, and this value will indicate an overbought or oversold. The RSI indicator has a default 14-period setting configure and located below the chart when activated. When the RSI value moves over 70 value indicators. It means that the asset is overbought, and the trader should be expecting a fall in price. If the RSI value moves less than the 30 value indicator. That means the asset is oversold, and an expected rise in price. I will try to demonstrate how to apply, and spot out the Sharkfin pattern using the RSI indicator on a chart.
- Uptrend Market:
During an up-trending market, the Sharkfin pattern has the shape of an inverted V pattern on the chart. The RSI indicator is added, a visible inverted V pattern is formed on the RSI section below the chart. A clear inverted V pattern occurred when the RSI value goes above the 70 value. This occurred at a rapid and equal movent of the market price.
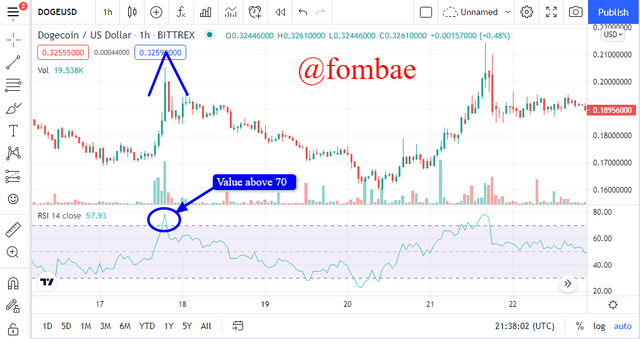 DOGE/USD chart above on 1h time frame and value above 70 (Sharkfin inverted V pattern)
- Downtrend Market:
For a down-trending market, the Sharkfin pattern has the shape of a V on the chart. When the RSI indicator is added, a clear V shape pattern is formed. Just like the case in the trending market, the RSI indicator value goes below 30 value.
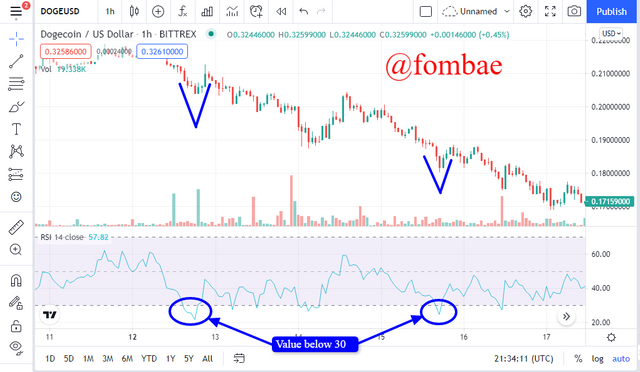 DOGE/USD chart above on 1h time frame and value below 30 (Sharkfin V pattern)
Be it in an uptrend or a downtrend, and the Sharkfin pattern is visible when the indicator shoots out of the 70 and 30 values respectively creating the inverted V and V pattern.
3 - Write the trade entry and exit criteria to trade sharkfin pattern (Clear Charts Needed)
Entry Criteria for Buy Position
- Make use of the RSI indicator to the chart (using the default setting) of the trading pair.
- Strategies your market time frame for entry (preferably small-time frames)
- Analyse the market, making sure you are having a visible downward movement in price and quick change in direction (upward) to create the V pattern.
- RSI value most move below and out of the 30 value and back forming the V pattern
- Make your buy order when the price is back above the 30 value.
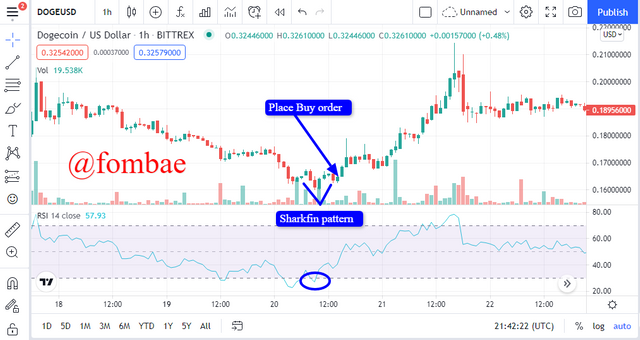 DOGE/USD chart above on 1h time frame
Entry Criteria for Sell Position
- Make use of the RSI indicator to the chart (using the default setting) of the trading pair.
- Strategies your market time frame for entry (preferably small-time frames)
- Analyse the market when it is in an uptrend while looking at the price. When there is a visible upward movement, and a quick reverse downward movement creates an inverted V pattern.
- RSI value most move above and out of the 70 value and back forming the inverted V pattern
- Make your sell order when the price is back below the 70 value.
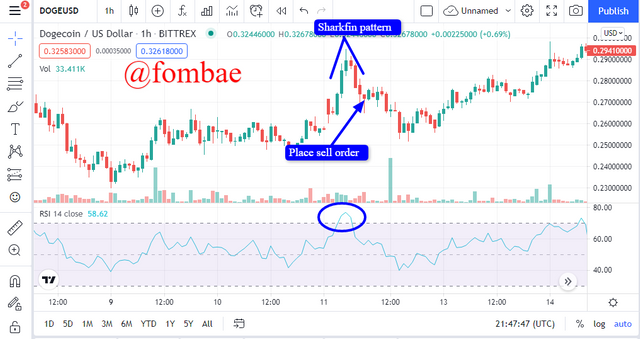 DOGE/USD chart above on 1h time frame
Trade Exit Criteria
Exit Criteria for Buy Position
- Make use of the stop loss tool, and Set the Stop Loss point below the swing low of the Sharkfin partner.
- Trade should be exited when the price crosses the stop loss level because the trade setup is invalidated.
- Apply a take profit level in other to benefit if the trade goes in the positive direction.
- Make sure you set the take profit RR(Risk: Reward) at 1:1 so that the take profit level is equal to the stop loss level. It is a good strategy for every newbie in trading.
- Exit the trade as soon as the price reaches the take profit level.
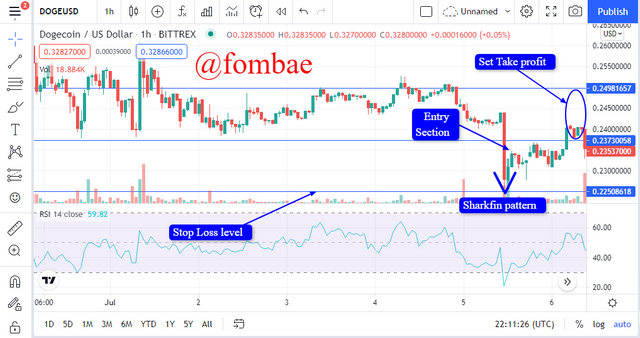 DOGE/USD chart above on 1h time frame
Exit Criteria for Sell Position
- Make use of the stop loss tool and Set the Stop Loss point above the swing low of the Sharkfin partner.
- Trade should be exited as soon as the price crosses the stop loss level because the trade setup is invalidated.
- Make sure you set the take profit RR(Risk: Reward) at 1:1 so that the take profit level is equal to the stop loss level. It is a good strategy for every newbie in trading.
- Exit the trade as soon as the price reaches the take profit level.
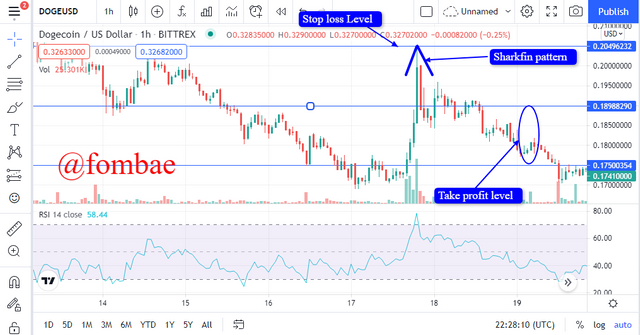 DOGE/USD chart above on 1h time frame
4 - Place at least 2 trades based on sharkfin pattern strategy (Need to actually place trades in demo account along with Clear Charts)
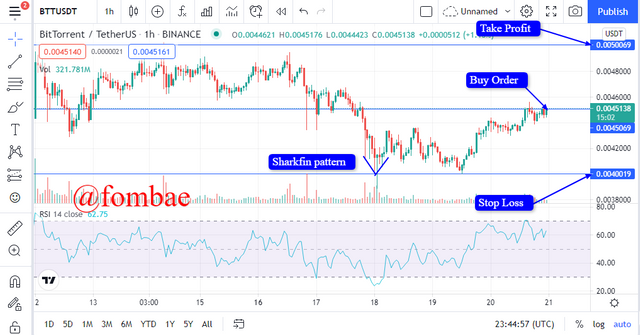
- Trade 1 BTT/USDT
In the BTT/USDT chart below, you notice the Sharkfin pattern was created, and I place a buy order at 0.0045. It was just when the RSI return into the 70-30 range value. I have set my stop loss at 0.0040 and take profit at 0.0050. My RR(Risk: Reward) is 1:1
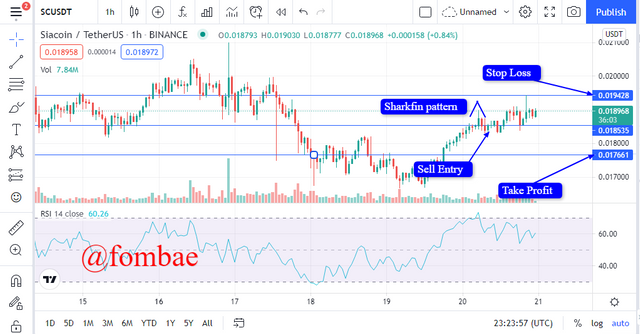
- Trade 2 SC/USDT
In the SC/USDT chart below, you notice the Sharkfin pattern was created, and I place a sell order at 0.0185. It is when the RSI returns into the 30-70 range value. I have set my stop loss at 0.0194 and take profit at 0.0176. My RR(Risk: Reward) is 1:1
Conclusion
Sharkfin Patterns will be formed when we have a rapid equal correction in the opposite direction of a price movement. This pattern is visible when it shoots out of the 70 - 30 value range of the RSI indicator. Putting into consideration Risk management in trading, Sharkfin Patterns is one of the visible strategies a trader should be looking into when trading. Like I always say, it is advisable to put more than one indicator when entry and exit of a market. I mention above for newbies, stick to RR(Risk: Reward) 1:1 for now and gain more experience in trading. Sharkfin Patterns can help traders from getting into false market trends. Thanks, prof @cryptokraze for this course. I have learned a new terminology in trading this week. See you next season, and Stay blessed
Respected Sir, kindly verify my achievement 1 introduction post
https://steemit.com/hive-172186/@mehvishh/achievement-1-introduction-post-by-mehvishh