Steemit Crypto Academy | Course 2 | How To Read Candlestick Charts In Different Time Frame & Information about Buy-Sell(Support & Resistance).
This is my fulfillment for this week's task, proposed by @stream4u:

Candlesticks
Only by taking a look at the graphic we can get a lot of information in a very visual and easy way to understand. We can infere what has been the opening and closing price, the highest and lowest the price has been and if the trend's bulling or bearish. If the candle is shown in a green colour, then the trend is upwards/bullish; if it's shown in red, that means the price is going downtrend/bearish.
I took this print from Binance:

From this image we can see that the candlestick from the left is bullish. It's opening price has been almost at 29 and the highest it's reached is 31. Still, the closing price was more or less at 30.75.
On the right, we can see that there's a bearish candlestick. Of course, opening price has been 30.75, but the price has gone down to almost 30. Still, the current price for this asset is 30.54.
Time frames & type of traders
Depending on what's your position, aversion to risk and how you want to operate with cryptoassets, it should define the time frame that you choose to see.
What type of trader am I?
Of course, you should never trade any amount of money that you need to live. But still, what you expect out of your trades will define the type of strategy that might work the best for you:
Scalping: These type of operations are real quick and do not exceed a few minutes. You won't be making huge profits from this, unless you have a huge amount to invest, and as soon as you place your buying order, you're already setting the selling one.
Short term trading: You hold your position for a bit longer that in the scalping, but not that much. You set achievable targets and sell your position once your assets gets to that point. Your intention with this type of trades is to just make a slightly better profit than with scalping, but you're not really into holding your position in that asset.
Long term trading: Once you set position, you hold it for at least a week, month or perhaps, even more. It takes a lot a patience and nerve to overcome the swings and fluctuation, but you wnat to make huge profits believing that your asset will increase it's price in the future.
Personally, I've been scalping in Argentina's stockmarket not long ago. It was a great choice for me, since my country's stockmarket is somehow really volatile and unstable, so it was not wise enough for me to hold position from one day to another. Despite this, I'm much more into long term trading when it comes to cryptoassets, for me it's all about finding the right projects that will likely develop into great structures in the future.
What type of time frame should I choose?!
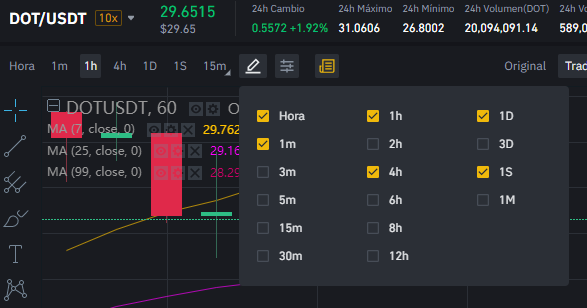
Depending on what's your type of trading, you'll choose your proper time frame.
As it's shown in the print, you get a different rage. In the column from the left, you get all the ones you can choose for scalping. In the one from the middle, it should be used for short term trading. For long term trading, you should choose from the column in the right.
Trends and charts will depend on what you choose and will show in very different ways, here are some examples that I've taken from Binance on Polkadot (DOT/USDT) assets.
5 minute view:

1 Day view:

1 week view:

On these two graphics we can see that this asset is on a bullish trend, with no major downtrends on the price. Also, from the 1 week view, we can see that the assets has been launched not that long ago, so mostly all volatile fluctuations might come as well from this lack of data recompilation.
On the 5 minute view, we can see that there's a resistance at 30.5 and another one at 31.
Resistance and support
By analyzing graphics, we can predict some of the movements of the assets.
We say there's a resistance when the uptrend in a price gets up to certain point and then it's hard for it go get past it. On the opposite direction, there's a support when the price can't go lower than certain point, these are the opportunities we should take advantage of to buy position.
This is a print taken from Binance, to see the fluctuation of Bitcoin:

Here, we see that there have been some moments in which BTC has been past 49.800, but it's pretty hard for it to maintain it and not get dragged down again. When it's in this price that we defined as resistance, we should sell.
As well as this, we find a support almost in 46K, and there have been great opportunities to buy as spikes have gone to a really lower point. When past the support zone, we should buy.
Meanwhile, once the prices is in the support zone, we should be patience and remain calm. We should never operate on our emotions, that's what I learnt from Argentina's stockmarket, lol.
Original task made by @stream4u can be found here
@steemcurator01 @steemitblog @steemcurator02

Hi @fendit,
You made a good post on Homework task 2, explained it very well.
Thank You For Showing Your Intrest in Steemit Crypto Academy
You have completed the homework task and made a good post, explained very nicely about How To Read Candlestick Charts In Different Time Frame & Information about Buy-Sell(Support & Resistance).
Remark: Homework Task Completed.
Thank You.
@stream4u
Crypto Professors : Steemit Crypto Academy
Thank you! Looking forward to next week's class :)