Crypto Academy Week 12 || Homework Post for Professor @kouba01 || Cryptocurrency Trading With RSI
Hi Steemians, this is my homework post for Professor @kouba01, on cryptocurrency trading with RSI
Q1. What is the Relative Strength Index - RSI and How is it Calculated?
Relative Strength Index (RSI), Is an oscillating indicator that is designed to measure a stock momentum, which is both the speed and size of the changes.
Many investors use RSI to determine whether a stock is Overbought or Oversold, by using this information, the investors can determine Entry and Exit signals.
In a nutshell, RSI measures or indicates momentum and also measures how fast price moves.
How RSI is calculated.
Step1. RSI = 100 – 100/1+RS
Where RS = Average Gains/Average Losses.
Steps in RSI Calculation
Identify a previous time period to use. The time period is generally 14 days, it can be shorter or longer.
Add up the average gains and divide by the average losses during your chosen time period.
Example;
Let's say, on the first 7 days the market closed with an average gain of 2% and in the next 7 days, it closed with an average loss of –9%
In calculation:
100 – (100/1+2% gain/–9% loss)
RSI = 100 – (100/1+2.22)
RSI = 68.8
It's just under 70.
Step2.
100 – 100/previous average gain
×13+current gain/previous average losses
× 13 + current loss
Q2. Can we trust the RSI on cryptocurrency trading and why?
We cannot entirely trust RSI on cryptocurrency trading because of the following reasons;
RSI is not always accurate therefore. RSI alone cannot be rely on because, it does not factor invents that influence the stock price such as, economic news, earnings and other fundamental aspects.
RSI can remain Overbought or Oversold for long periods of time. So, even if the divergence suggest that a stock might move to a certain direction, there is no guarantee to That.
Therefore, RSI is better used in conjunction with other forms of confirmation such as, Volumes and overall trend in the broader stock market.
Q3. How do you configure the RSI indicator on the chart and what does the length parameter mean?
Why is it equal to 14 by default? Can we change it? (Screen capture required)
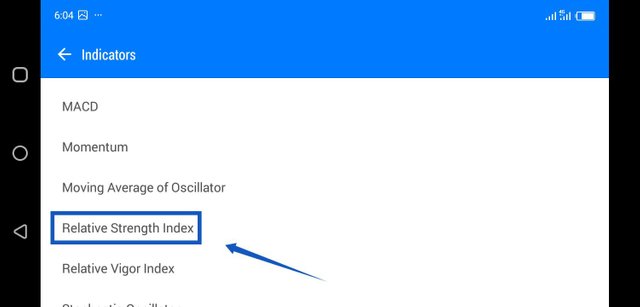
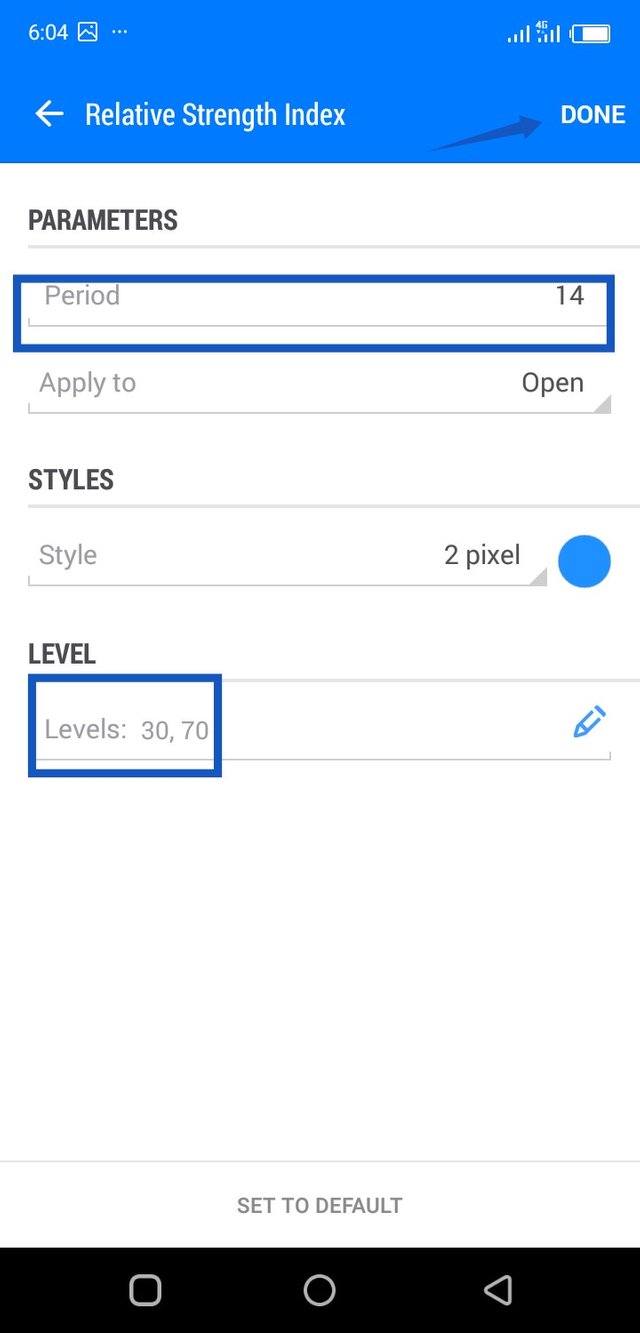
How to configure RSI indicator:
The RSI length parameter:
This function as a decider on how volatile/stable RSI is. It also decides the speed of reaction to the changing market.
The default Length/Period of 14 is because of the following reasons;
Lower specified period results, in higher number of buy and sell signals with, more frequency of some wrong signals.
So also, higher specified period count results, in lower number of buy and sell signals, with some of the genuine buy and sell signals being missed out.
Yes we can change the default 14 period by reducing or increasing it.
Q4. How do you interpret the overbought and oversold signals when trading cryptocurrencies? (Screen capture required)
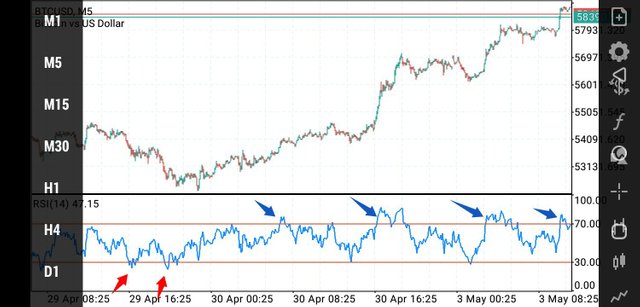
Overbought (Blue color): it is the RSI value above 70 and as it crosses back below 70, it ordinarily indicate an exit signal (sell).
Oversold (Yellow): it is an RSI value below 30 and when it comes back above 30, it ordinarily indicate an entry signal (buy).
Q5. How do we filter RSI signals to distinguish and recognize true signals from false signals. (Screen capture required)
In order to filter RSI signals you need to set your RSI settings to 200 periods. Here, the RSI indicator will look through the last 200 candles and measure the average gains and average loss, of the said last 200 candles. So, if over the last 200 candles the average gains is more than the average loss, the RSI indicator will be above 50 (buy).
So also, if over the last 200 candles the average loss is greater than the average gain, the RSI indicator will be below 50 (sell). It can be used on a long term. It all depends on the time frame.
Q6. Review the chart of any pair (eg TRX / USD) and present the various signals from the RSI. (Screen capture required)
I think the picture is self explained. However, the blue arrows entails that the stock is Overbought, which ordinarily indicates sell. So also, the red arrow which entails Oversold which ordinarily indicates buy. But in some situations you may wait because, it might go lower or stay low for longer period, same goes to the Overbought.
Conclusion.
Relative Strength Index is no doubt a powerful tool used to dictate entry and exit points. However, as I have already stated earlier, there is need for other tools for proper confirmation.
I most also thank Professor @kouba01, because this lecture is very rich in content and I just hope I have answered to his satisfaction. thanks


Hello @ericanthony,
Thank you for participating in the 4th Week Crypto Course in its second season and for your efforts to complete the suggested tasks, you deserve a 7/10 rating, according to the following scale:
My review :
Article with good content and convincing answers, thanks again for your effort, and we look forward to reading your next work.
Sincerely,@kouba01