Crypto Academy Week 16 - Homework Post for [@stream4u] technical indicator- pivot point
Hi guys ,welcome to another week of steemit crypto academy.Today I'll be writing about pivot points based on the lecture given by professor @stream4u.
PIVOT POINTS
Pivot points are a type of technical indicators that are used to predict the trend of the market.The pivot points are calculated using the high ,low and closing price of the previous day.Pivot points are the potential support and resistance of the market.
When the market closes at the top of the pivot point ,it is in a bullish trend .This would be the support and if the market closes below the pivot point,the market is in a bearish trend.This becomes the resistance.
PIVOT POINT LEVELS
The pivot points are of 7 levels;
SUPPORT 1(S1);
This is the first level below the main pivot point. This is the first level of support and this is in the oversold part of the market where traders often buy into the market . The trend could go up to become bullish or it could go down and become bearish.
SUPPORT 2(S2);
This is the second level of support below the main pivot point and it is in the oversold market and another level good for buying into a market.If the market goes below this point,it becomes more bearish and if it goes above this point,it might be the start of a bullish run.
SUPPORT 3(S3);
This is the third level of support and the 3rd level below the main pivot point.It is a very good position to buy into the market. This is often in the oversold position.If the market goes up,it will move towards a bullish trend and if it goes down ,then it goes to a bearish trend.
RESISTANCE 1(R1);
This is the first level above the main pivot point.The market is in an overbought position. If it goes below this position the market will be moving towards a bearish trend and above it in a more bullish trend.
RESISTANCE 2(R2);
This is the second level above the main pivot point. If it goes below this point,the market is going bearish and if it goes up ,it's going in a bullish trend. It is in an overbought position and a good time to sell.
RESISTANCE 3(R3);
This is the third level above the main pivot point. If it goes below this point,the market is going bearish and if it goes up ,it's going in a bullish trend. It is in an overbought position and this is one of the best time to sell.
MAIN PIVOT LEVEL(PP);
This is the main point and is called the pivot point. It often shows the direction of the market. If the candles are above the pivot point,the market is going bullish but if it is below the pivot point ,it is in a bearish trend. This point in the middle and it is gotten as the average of the high,low and closing price of the former day.
HOW TO CALCULATE PIVOT POINTS(PP,R1,R2,S1,S2)
The highest price ,lowest price and the closing price of the last day are used in calculating the pivot points.
To calculate pivot point(PP); (highest price+lowest price + closing price)÷ 3
The pivot point is used in calculating the resistance and support points.After calculating the pivot point,we can calculate the other points using their formulas;
R1 ; 2PP - LOW
R2 ; PP +HIGH - LOW
S1 ; 2PP- HIGH
S2 ; PP- HIGH - LOW
Luckily,most of these don't need manual calculation anymore as the system often does that for us automatically.
HOW TO ADD PIVOT POINTS ON A CHART
For this task,I'll be using tradingview. I'll highlight the steps below;
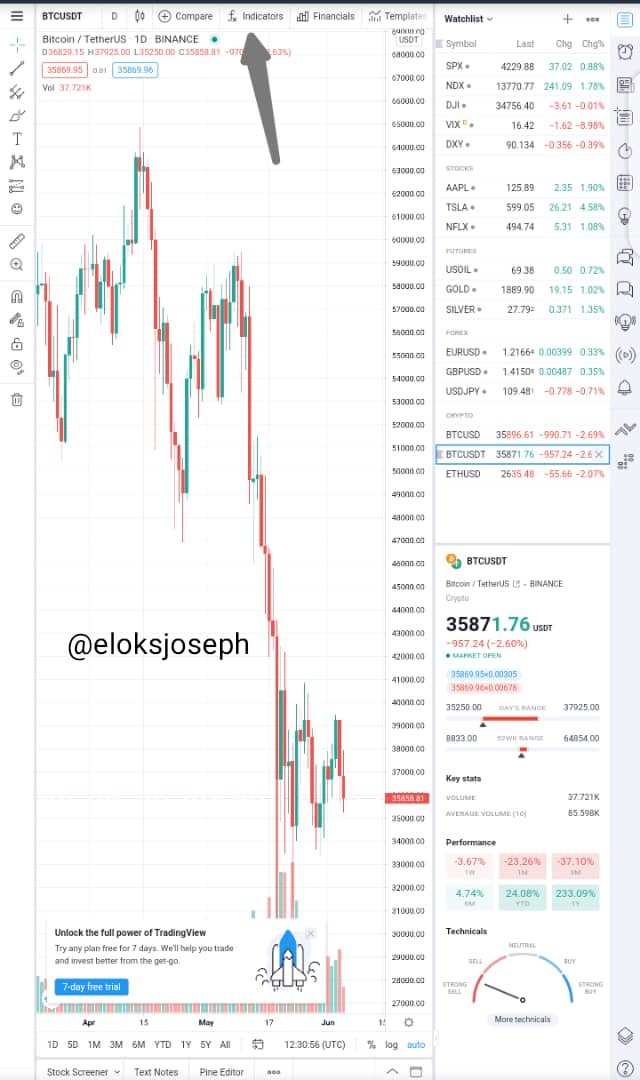
- Get into a chart and click on the Fx indicator.
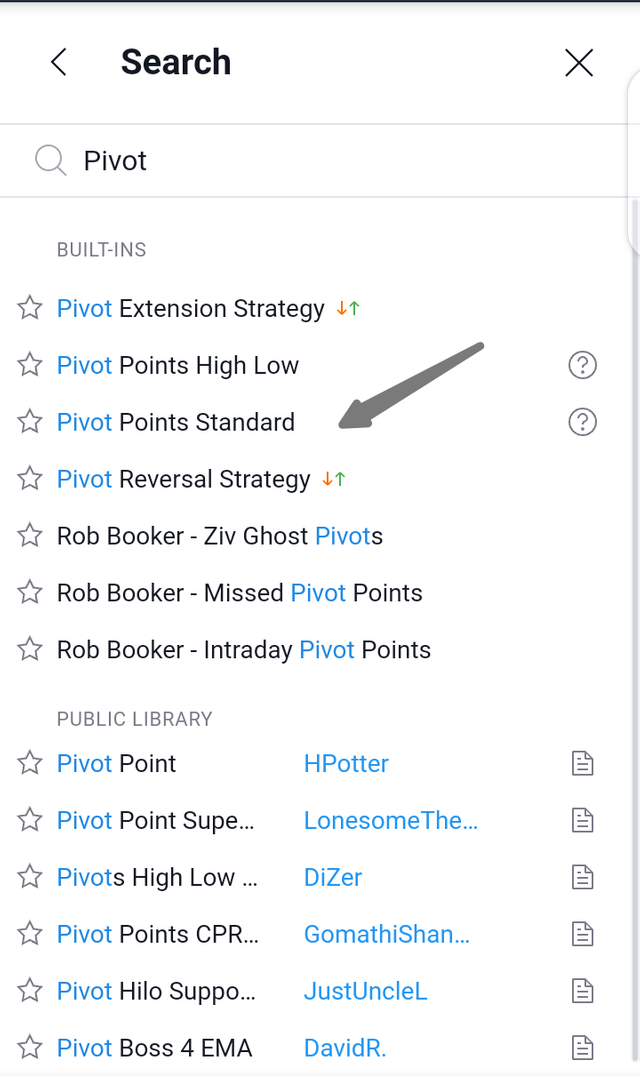
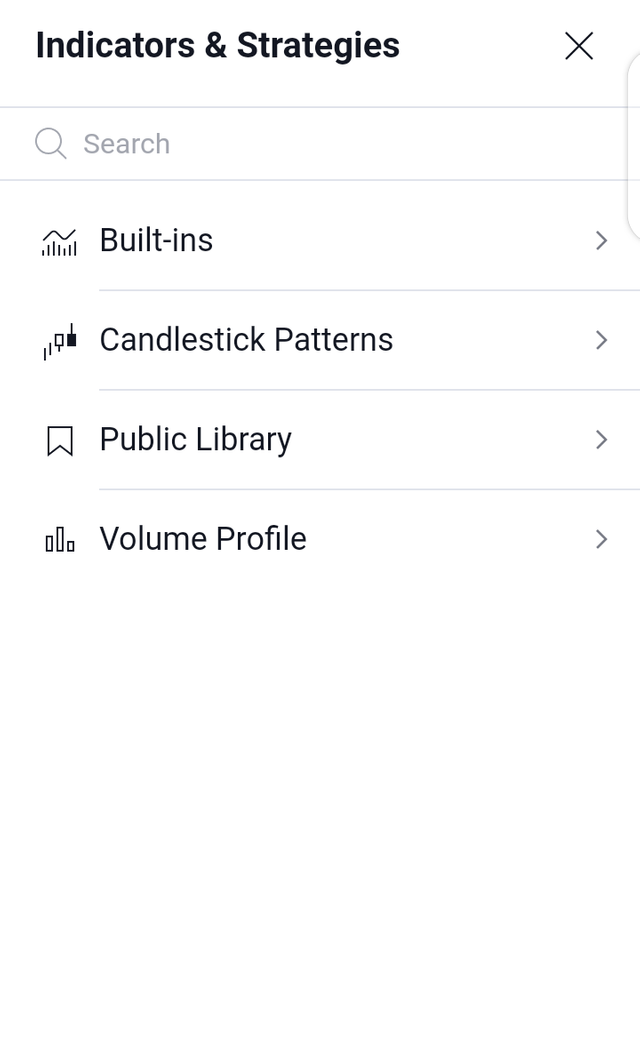
- After clicking on the fx indicator,you search for pivot point and click on pivot points standard.
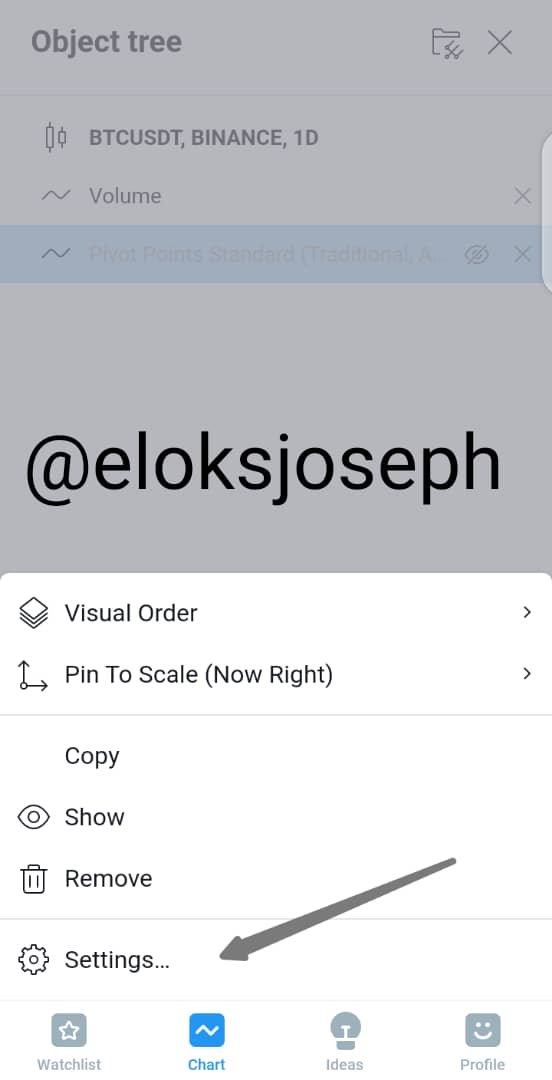
- Then we're going to align the settings for R1,R2,R3 ,PP ,S1,S2 and S3 only. You can also pick the colors you want your pivot points to be.
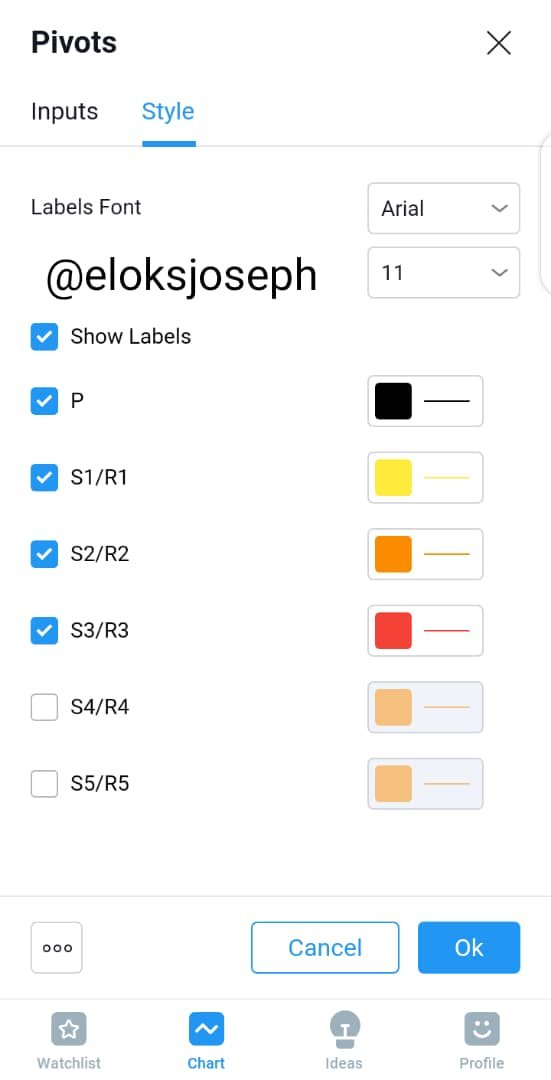
After using those settings, you'll see the pivot points and the main points on the graph with the color that you picked.
HOW PIVOT POINTS WORK
Like I said before,pivot points are used to determine market trends, thereby giving us an hint of when to go into or leave a market. When the candles is above the pivot points,the market is going bullish and when the candles are below the pivot point ,it is going bearish.
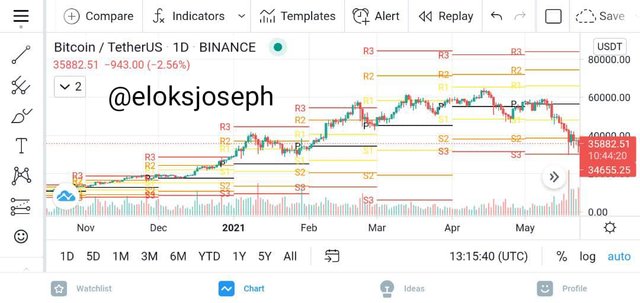
As you can see in the screenshot of the chart above,the candles were initially above the pivot point which means the market is in an uptrend.If it keeps breaking resistance level,then the market will keep going bullish. The trader can then set to take profit at the resistance level as a reversal could happen anytime.
In the screenshot above,the candles starts just below the pivot point showing that it is in a bearish trend.As you can see the market went a bit bullish before reversing back to a bearish trend.If the candles keep going below support levels ,the market is going more bearish and this can be a good time to buy into the market.
The resistance and support levels show how bearish or bullish a market is thereby giving us hints on when to buy or leave the trade .
PIVOT POINTS REVERSE TRADING
In trading ,theres no set time when a market would reverse its trend so using multiple indicators often help and also doing research about the asset you're trading. Here ,I'll be examining a graph that has undergone a bullish reversal using the pivot points.
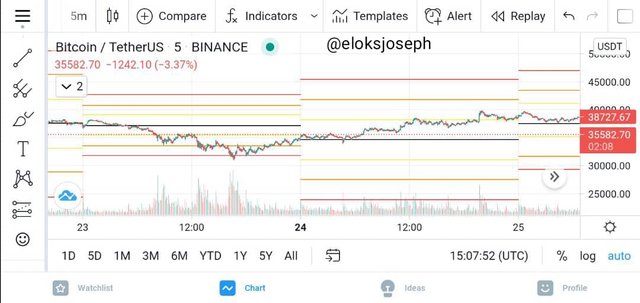
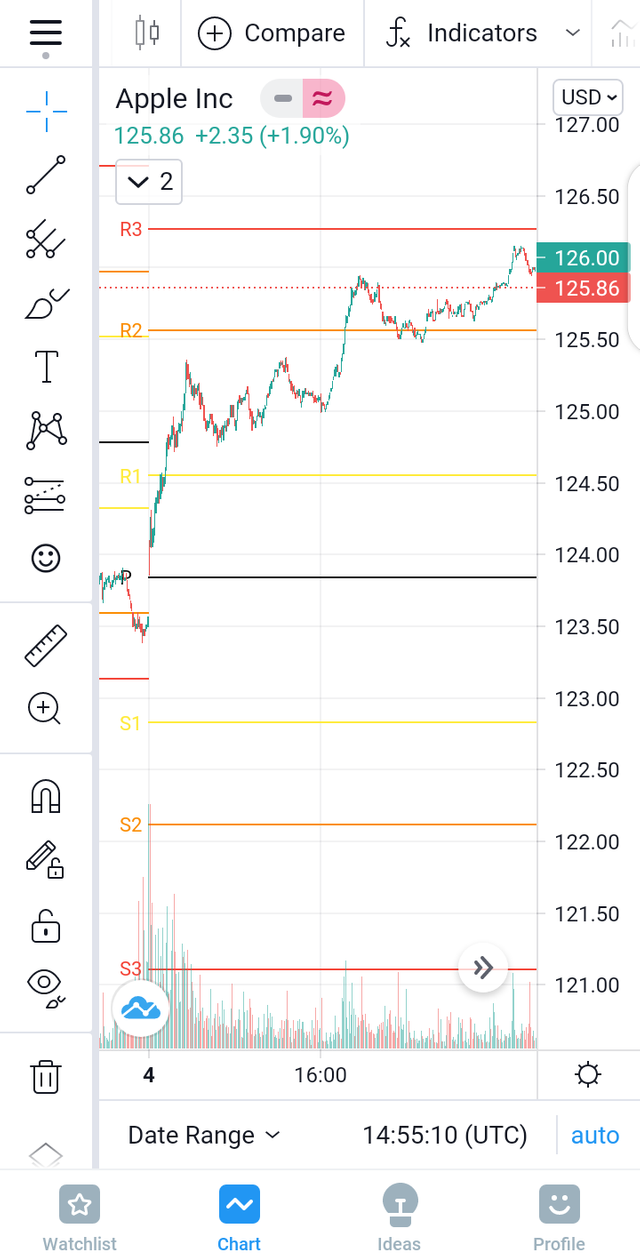
In the chart above, in the first part ,the market opens just below the pivot point and not long after goes above the pivot point but not touching the first resistance level.After an initial rise even without touching R1, the candles are seen to go below the pivot point and breaking support 1 to go hit S2. The market then tried to go up and break support 1 back again in an attempted uptrend but instead of going back up it dips again to break S2 and then eventually breaking S3.
As soon as the 3rd support line is broken,the market is seen to rise and fall again as it tests both S2 and S3. The market after an attempt to go below S3 then undergoes a bullish reversal and uptrends through S2 ,then finally closing close to breaking S1.
On the start of a new day ,the market is seen to start above the pivot point and breaks through R1.The market moves steadily and as it doesn't break below the pivot point,it uptrends again and goes above R1.
Using the pivot points indicator,when the market went below the 3rd support,it would have marked a good time to buy into the market and for short term traders, when the market had broken past R1,it might be a good time to sell .
COMMON MISTAKES IN TRADING WITH PIVOT POINTS
Like every other indicator used in technical analysis,the pivot points are not 100 percent efficient.
Some traders who don't have total understanding of trading might often make mistakes of putting 100% faith in the the pivot point indicator alone .
Another mistake is not setting a stop loss.Some traders believe that when then candles have passed the pivot point ,it'll keep going up in a bullish trend but sometimes that's not the case as it might move back down and start a downtrend.
REASONS PIVOT POINTS ARE GOOD AND HELPFUL TO A TRADER
Pivot points is an important indicator because it shows the current trend of the market .If the also shows the resistance and support levels of the market thereby giving it an insight on when to buy and leave a trade .This being the most important reason most traders turn to indicators for help.
Once a trade is going bearish or bullish,it is easily detectable by the pivot points and information on the trend on the market is vital for making maximum profit and minimal losses.
TECHNICAL ANALYSIS USING PIVOT POINTS
For this task, I'll be using the pivot points indicator to analyse the BTC/ USD chart.
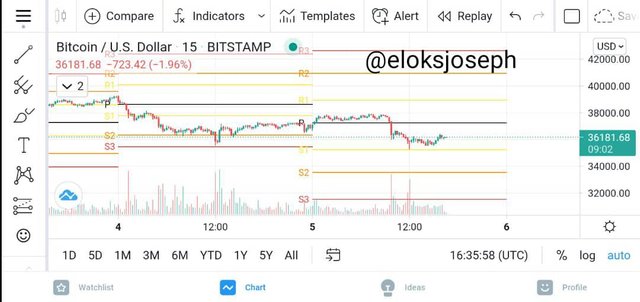
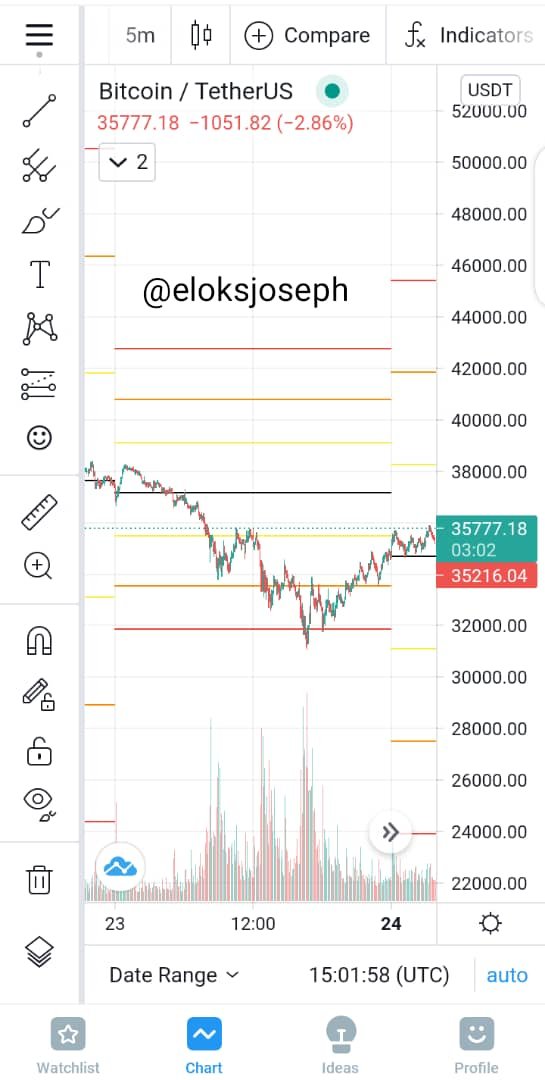
A new timeframe in the market opens with the market above the pivot point.The market doesn't stay long up there as it breaks below the pivot point to touch and go below the first support. The market then comes back up and then goes below S1 again to touch S2. The downtrend continues until the market touches S3.
As the market touches the 3rd support line ,a bullish reversal occurs and an uptrend starts as the market breaks past S2 be it temporary as it soons drops below S2 again but this time not touching the 3rd support line.The market barely goes below the S2 line before counting it's steady uptrend above S2.The market remains between S1 and S2 and closes the timeframe in that position.
In the new time frame,the market opens above the pivot point. The market is steady between the pivot point and R1 but never rises high enough to touch the first resistance level. The market then downtrends and goes below the pivot point to touch the first support line .The market then undergoes a little reversal as it rises from the 1st support line and is seen to be heading upwards.The market is currently in between the pivot point and the 1st support.
WEEKLY FORECAST FOR BTC USING THE PIVOT POINTS IN A BTC/USD GRAPH AND 4HR TIME FRAME
Bitcoin is a well known cryptocurrency and the number 1 ranked cryptocurrency on coin market cap,coin gecko amongst several others. It is the most popular cryptocurrency and I guess most of us know a bit about the coin. Well ,I'm going to be using the pivot point indicator predict the price of BTC in the coming week. I'll be using the BTC/USD chart.
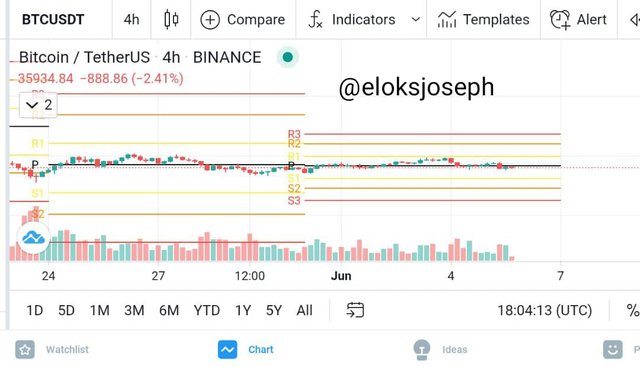
At the time of taking this screenshot, in the first time frame ,you can see that the market is not really volatile.It is going over and below the pivot point. After the first time frame,the market is seen to close below the pivot point.
In the more recent timeframe,the market continues in it's low volatility but this time ,the market goes up and touches the 1st resistance level before going back down to tread mostly along the pivot point.
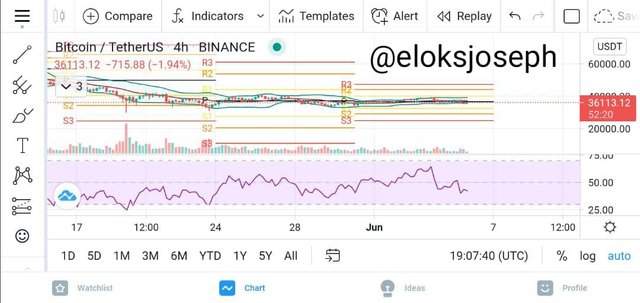
Not willing to rely on just the pivot points indicator alone, after checking the RSI graph,it is a good time to buy into the market as the market has a relatively low RSI. The Bollinger band indicator also show the market has a low volatility and is in the oversold region.
MY PREDICTION
The graph isn't really that volatile and with the way the pivot points are going,I believe the market would go up and break the 1st resistance level there by hitting about 38000USD as the high and if it otherwise goes down ,about 34000 USD as the low.
CONCLUSION
The pivot points indicator are a great indicator for technical analysis as they give proper information on the resistance and support levels of a market. This information given then assists a trader with an insight if when to buy in or leave a trade . It is a very good technical indicator that should be understood and used when trading.
Thank you for the lecture great professor @stream4u ,I really learnt a lot about the pivot points .
CC: @stream4u
screenshots taken from the tradingview app
#stream4u-s2week8 #cryptoacademy #pivotpoints #technicalanalysis #nigeria
Hi @eloksjoseph
Thank you for joining The Steemit Crypto Academy Courses and participated in the Homework Task.
Your Homework Task verification has been done by @Stream4u, hope you have enjoyed and learned something new.
Thank You.
@stream4u
Crypto Professors : Steemit Crypto Academy
#affable