Crypto Academy Season 03 - Week 06 | Advanced Course - Trading Liquidity Levels The Right Way by @eloksjoseph
INTRODUCTION
Hi guys welcome to steemit crypto academy season 3 week 6 . Today I'll be talking about trading liquidity levels the right way.


1)What is your understanding of the Liquidity Level. Give Examples (Clear Charts Needed)
2)Explain the reasons why traders got trapped in Fakeouts. Provide at least 2 charts showing clear fakeout.
3)How you can trade the Liquidity Levels the right way? Write the trade criteria for Liquidity Levels Trading (Clear Charts Needed)
4)Draw Liquidity levels trade setups on 4 Crypto Assets (Clear Charts Needed)
LIQUIDITY LEVELS
In the cryptocurrency ecosystem, when we talk of the word liquidity , we often refer to the speed at which a crypto asset could be sold. It is how fast the coin can be turned into money or turned into other cryptocurrencies. It should be noted that liquidity deals with volume.
Liquidity levels are really easy to understand. In some charts, we often see candles we often see l hammer and inverted hammers signifying a quick reversal. Liquidity levels are levels in the chart that exhibit swift reversals. These reversals are caused by orders place by traders. It could be stop loss, buy order ,etc.
It should be noted that these levels are often manipulated by large institutions in a situation whereby they flood the market with high volumes so as to cause an outbreak off the liquidity levels which is called a fakeout.
Before we head into what fakeouts are,let's take a look at some liquidity levels on a live chart.
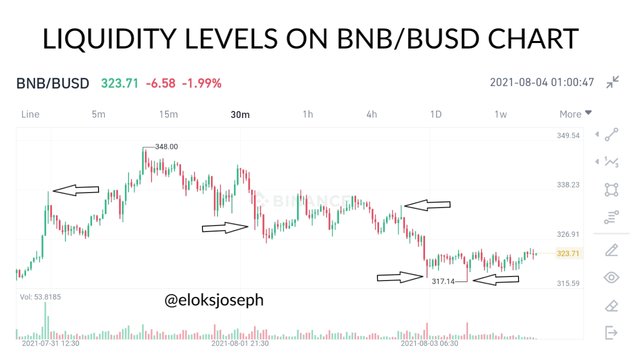
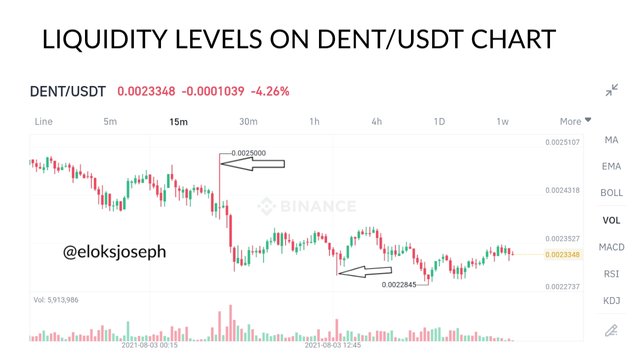
In the charts above , I have identified the liquidity levels. It can be seen that at these levels there were sharp prove reversals as the opening/close price were very far from the period high/period low.
This quick reversal is a result of the work done by institutions to trap small time traders. In the BNB/ BUSD and DENT/USDT chart, several liquidity levels have been marked out showing swift reversals.
FAKEOUTS
Fakeouts are caused by institutional investors, that is , controllers of large volumes. The fakeouts often occur when the institutions manipulate the liquidity volumes. The method is a very smart but selfish one and it's a really cunning move.
The institutions would invest a lot of volume in one direction thereby deceiving small time traders to buy into that direction , the large volume invested in one direction often draws small time traders into the trade. Then once the institutions have reached the level they want, they'll withdraw and invest in the opposite direction, causing a reversal and causing lost of losses to small time traders.
Some reasons why traders are trapped in fake outs include;
FOMO - Some traders would jump into a trend without proper analysis and research because they're scared of missing out.
Sticking to one strategy - for most novice traders , breakouts are bad news as they don't have strategies in mind to trade with breakouts ,so they make decisions based on emotions instead which doesn't always work.
CHARTS SHOWING CLEAR FAKEOUTS
In this section,I'll be identifying some fakeouts in the graph.
- FAKEOUT IN DENT/USDT CHART (BULLISH REVERSAL)
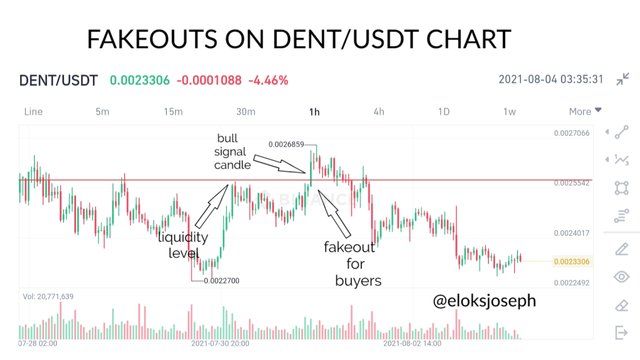
In the chart above , we can see that a liquidity level had initially been reached. Then there's a bullish break out which was caused by institutions loading the market with large volumes to attract small traders and deceiving them into thinking it is a buy entry. Once the new level had been reached, they quickly pulled out and invested in the other direction causing a reversal and then eventually a downtrend . This way, they have fooled some small time traders who fell for the trap.
- FAKEOUT IN DENT/USDT CHART (BEARISH REVERSAL)
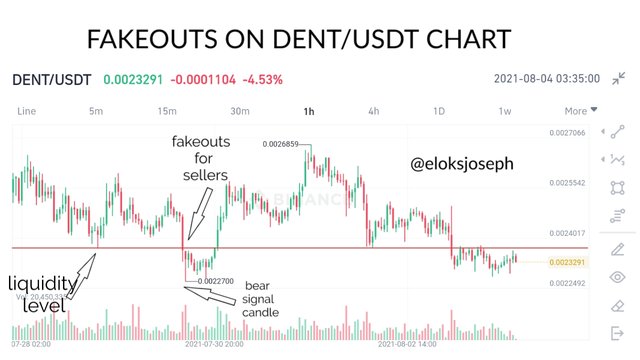
In the chart above , another liquidity level had been reached before the influence of institutions caused a long bearish candle to reach a new liquidity level . Once enough liquidity has been reached, the institutions then buy in the other direction causing the market to go bullish. A direct opposite to the previous signal.
HOW TO TRADE THE LIQUIDITY LEVELS THE RIGHT WAY
There are two (2) ways we can properly trade the liquidity levels. We could use the market structure break (MSB) or the break retest break strategy (BRB). Other indicators can also be considered for a more successful trade.
TRADE CRITERIA FOR LIQUIDITY LEVELS USING MSB STRATEGY
- BUY ENTRY:
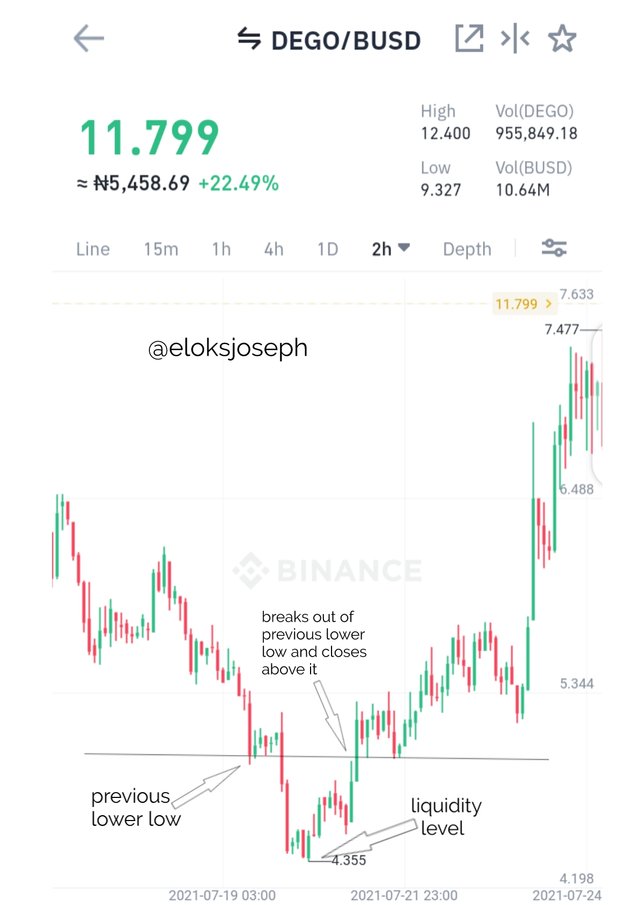
To trade the MSB in a buying position,the market should be undergoing a down trend and you should be patient for it to reject and reverse from the liquidity level. Once it breaks out of the previous lower low and closes above it, is is advisable to buy into the trade.
- SELL ENTRY :
The market should have initially been going through an uptrend and then rejected the liquidity level. Market out the last higher low and be ready to enter the trade in a sell position if the market closes below the previous higher low.
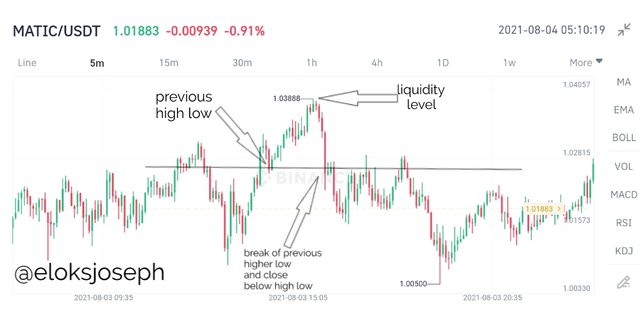
The market can be seen to experience a down trend after.
- EXIT CRITERIA:
To exit the trade, we ought to have initially set a stop loss. The stop loss and take profit should be in the ratio 1:1 as it is the best advisable ratio to use when initially using a new strategy an as the trader gets better , it could be changed to preference.
TRADE CRITERIA FOR LIQUIDITY LEVELS USING BRB STRATEGY
- BUY ENTRY:
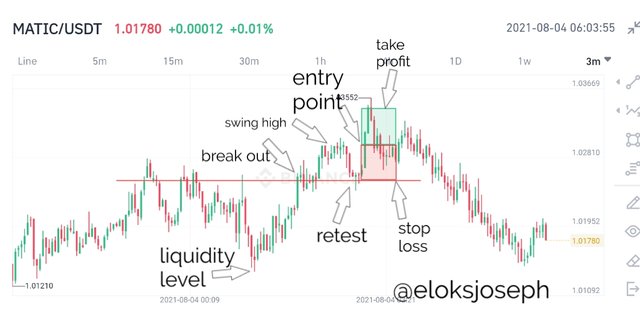
To trade the liquidity level using BRB strategy and at a buy entry, you'll be required to watch the market until it reverses from the liquidity level . After it has reversed, identify the resistance level and watch closely until it breaks it. Wait for it to retest and place your buy entry just after the market crosses the initial swing high.
- SELL ENTRY;
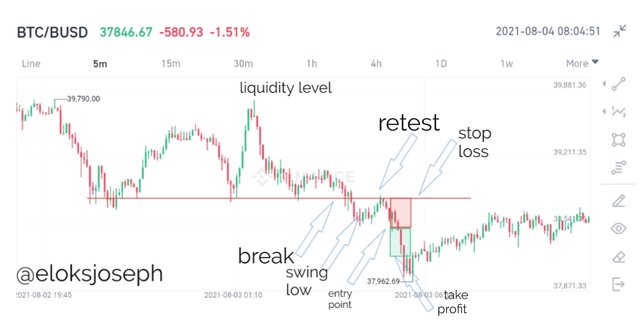
On the other hand, if you want to enter the trade in a sell position, you'll also wait for the market to reverse from the liquidity level. Wait for the downtrend and take note of when it breaks support. Wait for it to retest then enter when the market has passed the former swing low.
- EXIT CRITERIA;
As always ,during trading it is advisable to set your stop loss and take profit. It is also advisable to trade with a 1:1 risk reward setting .
If you check the images above, I have identified possible entry points , stop losses and take profit levels.
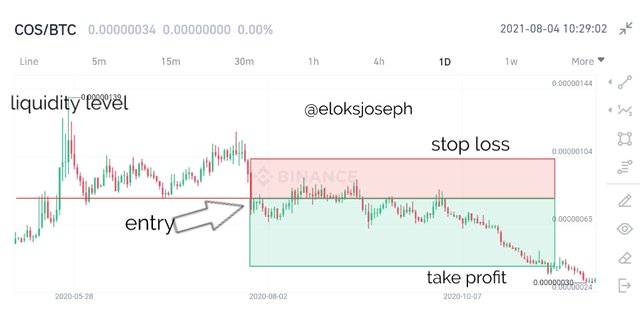
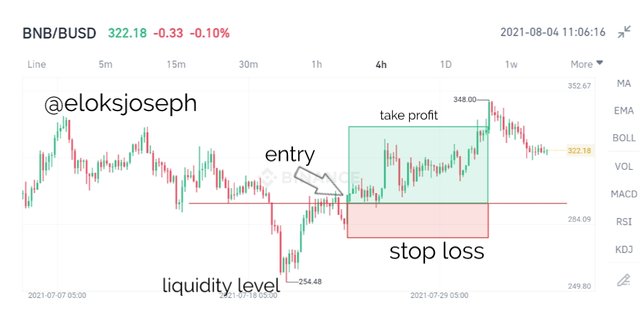
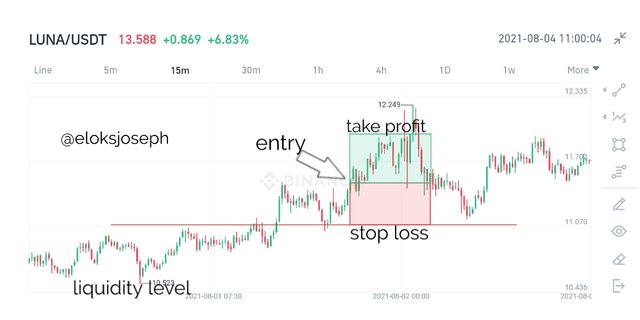
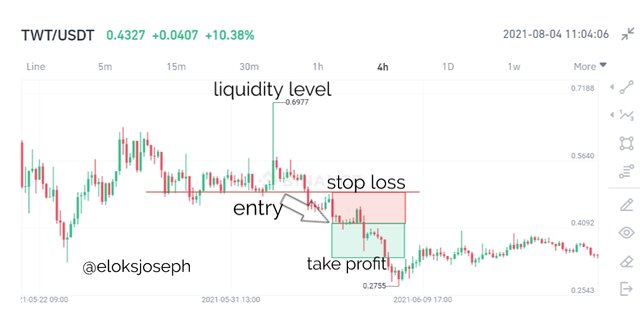
LIQUIDITY TRADE SET UP ON CRYPTO ASSETS
TRADING THE LIQUIDITY LEVEL USING MSB STRATEGY IN A SELL POSITION
TRADING THE LIQUIDITY LEVEL USING MSB STRATEGY IN A BUY POSITION
TRADING THE LIQUIDITY LEVEL USING BRB STRATEGY IN A BUY POSITION
TRADING THE LIQUIDITY LEVEL USING BRB STRATEGY IN A SELL POSITION
CONCLUSION
Liquidity levels should be properly studied before trading as they are often deceiving and are mostly set up to lure in small time traders.
The MSB and BRB strategies are efficient strategies you can use to properly trade the liquidity levels.
Thank you for your lecture professor @cryptokraze.
@tipu curate
Upvoted 👌 (Mana: 1/6) Get profit votes with @tipU :)