Crypto Academy Week 10 - Homework Post for @stream4u | Price Forecasting
Good day everyone, it’s a privilege to contribute to Crypto Academy Season 2 Week 2. After reading @stream4u’s guide on this week’s task, I’m delighted to participate. In today’s article, we will look at price forecasting.
What Is Price Forecasting?
When you hear the term forecasting, what comes to your mind? Predicting the future, right? However, in the cryptocurrency markets, price forecasting has to do more with the methods that traders and investors use to determine the future value of a coin or token. When the prediction is successful, the trader makes a sizable profit.
While predicting the movement of a crypto, the trader looks at the chart movement of the token. When the chart moves upward, it is referred to as an uptrend. Whereas, when it moves downward, it is referred to as a downtrend. Therefore, an upward trend means that the value of the token is increasing.
During the process of forecasting cryptos, a trader would often consider the fundamental analysis, technical analysis and sentimental analysis. When these techniques are used efficiently, traders are able to make better decisions with regards to the price movements.
Why is Price Forecasting needed?
From personal experience, I’ve learnt that the chart always tell a story to those willing to listen. The data represented by the charts help traders to make better decisions. This is because it is often backed with data and recent events in the crypto sphere. So a trader can derive what could happen next.
A newbie may view a crypto chart as unimportant. On the other hand, it takes a pro-trader to know the right analysis to use at a particular time. The movement on the crypto charts help a trader know when to hodl on to tokens and when to sell. And in the crypto world, knowing the best time to enter a trade could mean thousands of dollars.
For example, a trader that have studied Bitcoin charts for years is able to determine easily the support and resistance by using technical analysis. So he knows when to sell BTC before a bear market comes knocking.
What Methods are best you feel for Price Forecasting?
Personally, I’m a big fan of technical analysis. I feel it is a gift to traders. But honestly, combining technical analysis with fundamental analysis and sentimental analysis makes one a better trader.
| Technical Analysis | Fundamental Analysis | Sentimental Analysis |
|---|---|---|
| Data-driven | Research-based | Driven by emotions |
Technical analysis: It involves studying the historical prices of the cryptocurrency. That way a trader would take into consideration the current price of the coin, the chart movements, circulating supply, and the trading volumes in exchanges. The belief in technical analysis is that crypto follows a repetitive trend. Having that in mind helps the trader makes a well-informed decision.
Fundamental analysis: This method of analysis focuses beyond the current price. The focus is on the problem the crypto solves and its aim. A fundamental analyst will often read the whitepaper and compare the project’s progress with its roadmap. This helps the trader to determine if a token is overvalued or undervalued. When it’s undervalued, then a bullrun is lurking, whereas when it is overvalue, then a trader would expect correction.
Sentimental analysis: It involves getting trading signals from crypto influencers, celebrities and other well-known personalities. In this form of investment there may not be data to back up reason for investing. For example, when you see Elon Musk tweeting “doge to the moon” and you log into an exchange to buy doge, that’s sentimental analysis in progress.
Pictorial Illustration Showing how to Analyse the Price of a Crypto Asset to Determine the Future Price
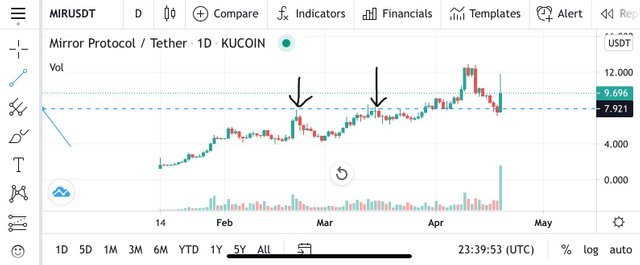
For the purpose of this analysis, I’d be analysing the Mirror Protocol token (MIR/USDT). We will take a look at the chart pattern of the token for last few months on KuCoin exchange.
Image 1
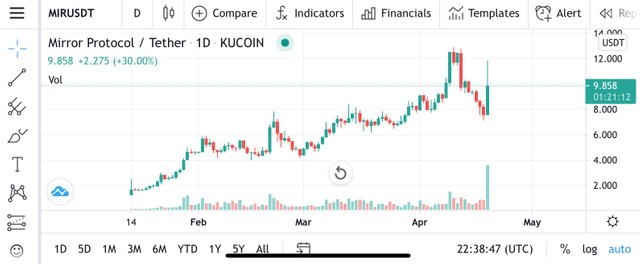
The image above is a screenshot from TradingView showing the chart of MIR/USDT from January till date.
Image 2
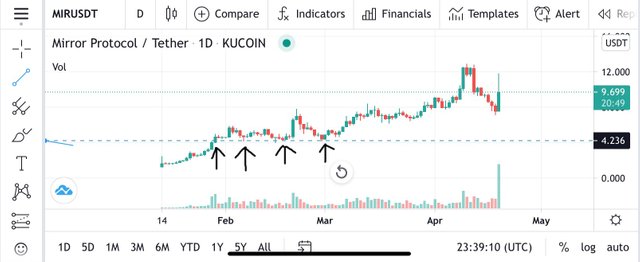
From the above screenshot, it shows the support line. It is quite easy to determine that from the chart. You will notice that the price of $MIR bounce back from that line a couple of times before an uptrend was formed without returning to the support line. Another thing you can notice from my support line is that it touches at least two points on the graph.
Image 3
The image above shows the resistance line. It can be observed that the price of the token went downwards a couple of times after meeting the resistance. That can be described as the market testing its resistance. In that process some trader will take will profit and that will result in another price drop. Also, when the resistance line is tested a couple of times, it yields to a new price discovery.
Similar to the support line, the resistance line require more than one point to be drawn correctly. Eventually, when the price breaks the resistance it leads to a breakout. As a result, more traders become optimistic with regards to the trade. Future traders can start longing the trade at this point.
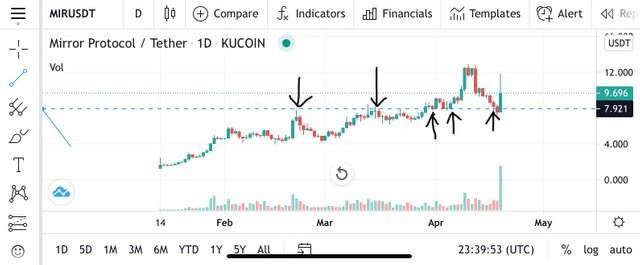
As can be observed from the chart above, the resistance line is about to become the new support line. When $MIR continues this way, we can expect a new price discovery.
Hence, I would say that the token is bullish. I currently own about $18 worth of $MIR to test how the market turns out. With the current circulating supply and analysis, I would say the coin is greatly undervalued. I expect a 100% increase in the next 3 months if the bullrun continues.
Conclusion
In a general sense, price forecasting helps investors and traders to uncover trends, i.e. to have knowledge on the price movements they see. I cannot say it is 100% accurate, because it isn’t. It is best to combine technical analysis with fundamental analysis in order to find the hidden gems on coinmarketcap. That way investors can make good decisions and have more opportunities come their way.
I would like to thank @stream4u for his lecture, and also thank @yousafharoonkhan who is assisting him this week.
Hi @eloghosa
Thank you for joining The Steemit Crypto Academy Courses and participated in the Week 10 Homework Task.
Your Week 10 Homework Task verification has been done by @Stream4u, hope you have enjoyed and learned something new.
Thank You.
@stream4u
Crypto Professors : Steemit Crypto Academy
You've got a free upvote from witness fuli.
Peace & Love!