Crypto Academy Week 16 Homework Post for Professor [@stream4u] Technical Indicator: Pivot Points homework by @ebiis
By Prof @stream4u
Home work:
Picture from canva
1, Discuss your understanding of Pivot Points. (Title For this topic will be Pivot Points)
As defined by the Oxford English Dictionary as “the central point, pin, or shaft on which a mechanism turns or oscillates”. Pivot Points in machines act as a support to the turning parts of the machine. So we can say pivot points aid the turning or oscillation of machine parts. It’s an integral part of a machine. Without pivots, it will be extremely difficult for machines with turning parts to function effectively.
Applying this idea to crypto-trading, pivot points are a technical indicator used for determining the movement of markets whether it is being bullish or bearish.
Though mostly used by intraday traders, the Pivot Point uses the concept of Resistance and Support levels to determine the changes in sentiments of the market.
For forecasting day trades using this indicator, a good knowledge of the calculation of pivots is important and should be well understood by traders to get the best use of this
indicator.
Source
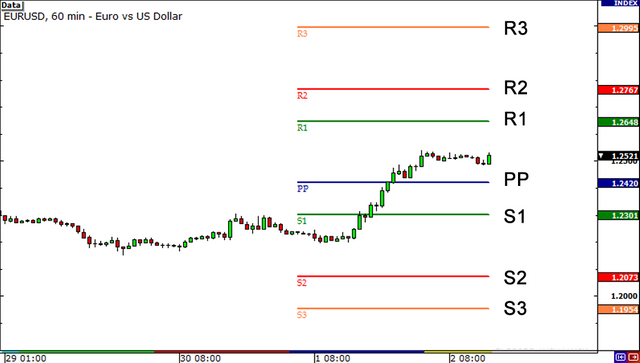
The Pivot Points uses the previous high, low, and closing positions in trades of the previous time frame to calculate the current position of the trade. The high-level position is known as the Resistance while the low position is known as the support.
With the information gotten from pivot points, traders can use it to calculate the possible pivot points on their current day trades.

2, Details about Pivot Point Levels.
Traders are moved by emotions which could be greed, happiness, or fear. There are certain positions reached by traders where these emotions display more which usually leads to change in market patterns known as the resistance and support lines.
When a bullish market rises to a point that before it starts retracing, it is said to have met resistance. At this level, out of sentiments traders feel that the price of the asset is overbought and overvalued, so the prices begin to drop.
Also, when a bearish market falls to a point before it starts trading up again, it is said to have met support. At this level, out of sentiments, traders feel that the price of the asset is undervalued and oversold, so the prices begin to rise again.
Screen shot from trading view
To grasp the concepts of the Pivot Points, there are important details we have to discuss. These are known as the Pivot levels. These are significant points that are considered vital in extracting information from Pivot Points.
The Main Pivot Level
The most important point is the Main Pivot Level. As fulcrums are to simple machines, so is the Main Pivot level to the movement of market prices. This acts as the equilibrium between the Highs and Lows of the markets which are also called the Resistance and Supports. Prices above the Main Pivot level are considered a bullish sign while if the price goes below the main point level, it is said to be bearish.
The main pivot level is used for calculating the estimated support and resistance of the current trading session. The usefulness of the main pivot point is in its use in calculating these levels which are important in the prediction market movements.
Support 1
This is the first pivot level below the main pivot point on the chart. At this point, it is possible that the price will move in the reverse direction and the market position becomes bullish.
Support 2
This is the second pivot level below the main pivot point and it’s also below the support 1 on the chart. If there is a breakout at the first support level, when it gets to this level, there is a possibility that the price will move in the reverse direction and the market trend changes to bullish. However, if a breakout occurs at this level, then there is a greater possibility that the market will be more bearish.
Support 3
This is the third pivot level below the main pivot point and it’s also below support 1 and support 2 on the chart. At this level, the market trend can change to bullish as this is generally called an oversold zone. If there is a breakout in this zone, then a more bearish trend is likely to occur.
Resistance 1
This is described as the first pivot level above the main pivot level. At this level, it is likely possible that a reversal may occur due to overbuying of the assets. There is still a possibility of a bullish trend if a breakout occurs.
Resistance 2
This is described as the second pivot level above the main pivot level and it is also above the first resistance level. If the price of an asset gets to this level, there is a possibility of a change in direction of the market trend from bullish to bearish but if there is a breakout, then it defeats the possibility of the bearish trend.
Resistance 3
This is described as the third pivot level above the main pivot level and it is also above the first and second resistance level. Also, there is a greater possibility that the market will reverse in its trend from bullish to bearish. A breakout at this level might prevent the reversal of the market direction.
3, Pivot point Calculation and R1,R2,R3 and S1,S2,S3 calculations.
The Pivot Levels are calculated below:
Main Pivot level (PP) =(Daily High + Daily low + Close) / 3
Support 1(S1) = 2 X Pivot Point – Daily High
Support 2 (S2) = Pivot Point – Daily High – Daily Low
Support 3 (S3) = Daily Low – 2 X Daily High – Pivot Point
Resistance 1 (R1) =2 X Pivot Point - Daily Low
Resistance 2 (R2) = Pivot Point + Daily High – Daily Low
Resistance 3 (R3) = Daily High + 2 X Pivot Point -Daily Low
4, How to Apply Pivot Point on Chart.
I will be using Kucoin to demonstrate the application of Pivot Point on a chart.
Kucoin is one of the best Crypto- Trading Exchange platforms.
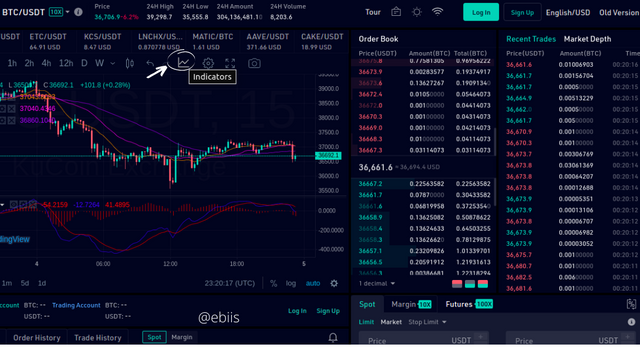
The crypto-asset pair used in this demonstration is the BTC/USDT pair and its time frame is the 15-minute chart.
Screen shot from trading view
The very first step is to click on the Indicator icon as shown above in the figure.
After clicking on the indicator icon, under the list of Indicators, click on Others, then Select the Pivot Points Standard. Clicking on this brings up the Pivot Points automatically on the chart. The fastest of the Pivot points solely depends on the strength of your network.
Formatting Pivot Points.
Screen shot from trading view
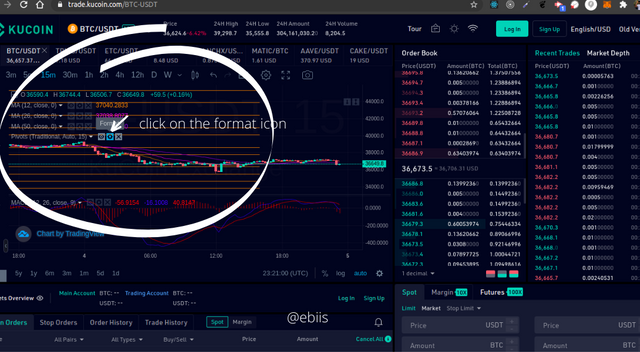
Looking through the selected circled area, you will notice horizontal orange lines these are the different Pivot Point Levels. But we can’t with it like this. It needs to be formatted to make use of it.
To get started with the formatting, click on the format icon as shown in the figure above.
There are two options available when formatting. We have the Inputs and the styles options.
Screen shot from trading view
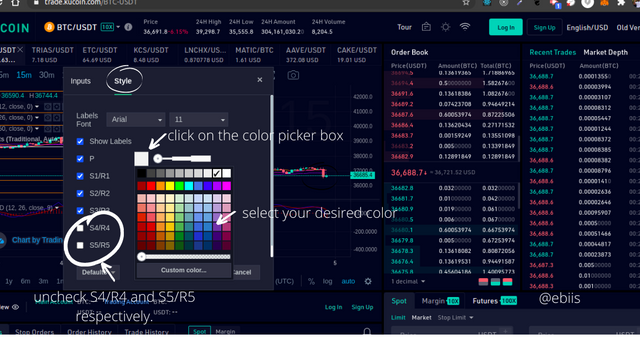
The style option
C lick on style, then un-check the S4/R4 and S5/R5 boxes respectively.
After this, choose the color styles for the respective Pivot Point Levels. For the Main Pivot Point level, indicated as P the color selected is white, S1/R1, S2/R2, and S3/R3 were purple, orange, and green respectively.
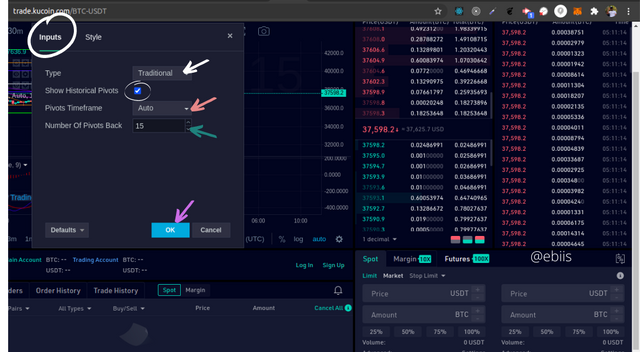
The Input Option
Screen shot from trading view
Formatting Pivot Points using this option, in the Type, the Traditional option is selected from the list, the show Historical Points is checked, Time-frame is set to Auto and Number of Pivots Back is set to 15. After all, there has been selected, click on the OK button beneath.
5, How Pivot Points works
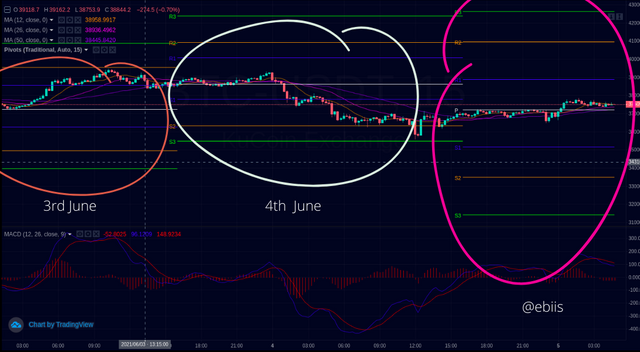
In my explanation, I will be using one Main Pivot Points, three Resistance Points, and 3 Supportive Points.
Screen shot from trading view
This trade setup shows the Pivot Point levels of three days from the 3rd to the 5th of June. Pivot Points are mostly used by day traders.
Screen shot from trading view
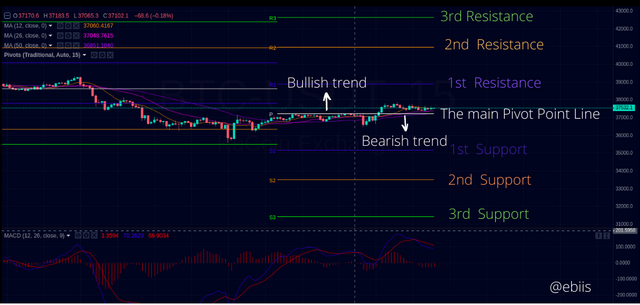
From the chart above,
The main Pivot Level Point Line is white in color.
The 1st, 2nd, and 3rd support points and Resistance points are blue, orange, and green in color respectively.
The most important of the Pivot lines is the Main Pivot Lines which is at the center of the Resistances and Support Lines.
When the price of an asset moves above the main Pivot Lines, it signifies a bullish market and if the price of the asset is below it, it signifies a bearish market.
The blue lines are the S1 and R1 respectively.
When trades get to the R1, there is a tendency of trade reversal, but if a break-out occurs, it becomes more bullish till it gets to the R2 and R3 as the case may be. The same thing occurs when the trade gets to the S1 region too.
6, Pivot Point Reverse Trading
Point Reverse Trading can occur at any of the Point levels R1, R2, R3 and S1, S2, S3 respectively. This occurs when there is either a Resistance (i.e. a bullish trend) or Support (i.e. a bearish trend).
The figure below shows a Pivot Point Reversal of the BTC/USDT pair in a 15-minute time frame which occurred on 2021-05-23.
As observed in the chart, the previous days' trade was in a bearish trend. When it got to the $31,000 price level, it encountered a Pivot Point Support 1. This is regarded as the first oversold zone. At this point, due to the oversold assets, a Support was made and a Pivot Point reversal was experienced.
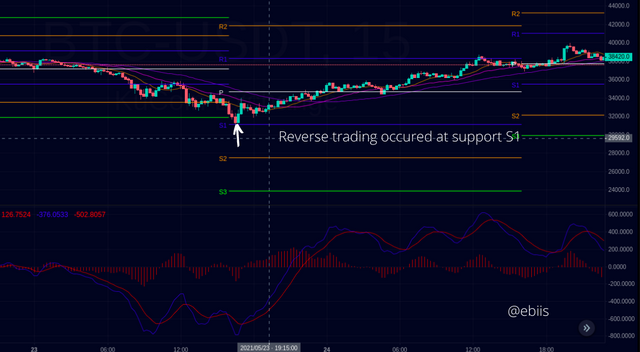
Charts of BTC/USDT showing a Pivot Point Reverse Trading.
7, What could be a common mistake in trading with pivots
As mentioned earlier in the course, Pivot Point Trading is mostly used by short-term traders (day traders). One of the common mistakes is that it is mistakenly used for long trades. The Pivot Point Trades are suitable for Day trades and shouldn’t be used for Long term trades.
The mistake of entering into a Pivot Trade without proper study and seeing the market price action of the underlying assets in question.
We know quite all right that the Pivot Point Trades are suitable for day trades, it is also advisable to check higher time frame charts before entering into a trade in the shorter time frame.
Using so many technical indicators. An example is an ETC /USDT trade pair. When so many indicators are used, it however forfeits the use of the Pivot Points Indicator.
Here we can observe that this trader could make a higher profit if he entered the trade when it got to the first R1 initially at $79.0595 at 3:30 pm, but because of the MACD indicator, he had to wait for an interception between the signal line and the MACD line at $76.4715 at 4:15 pm. Thus making the trader hit the trade at a late entry. When there are multiple indicators used in a particular trade setup, it causes a lot of confusion thus making the trader lose a significant sum of money.
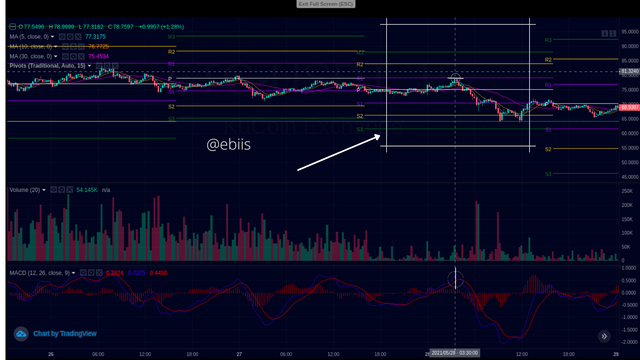
Figure showing the Interception at R1. Screen shot from trading view
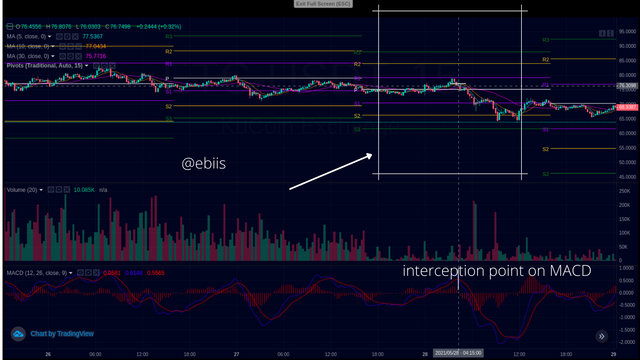
Figure showing the interception of the MACD line and the Signal line. Screen shot from trading view
8, What could be the reasons why Pivot Points are good. Pros/Adv
Pivot Point Indicator is one of the best indicators used by day traders in forex trading.’
It offers a lot of benefits and reduced risk to traders.
It is easy and quick to grasp. This is because the learning curve is short and its profit margin is high.
9, Apply the Pivot Points Indicator
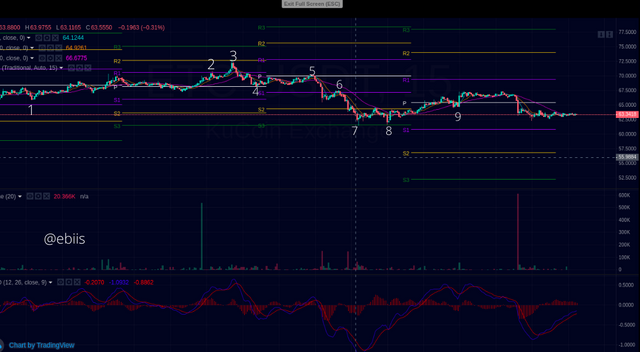
This is an ETC/USDT asset pair.
From the chart above using the Pivot Point Levels, the Main Pivot point is the white color horizontal line at the middle of the Resistance and Support lines. The R1 and S1 are purple in color, the R2 and S2 are orange in color while the S3 and R3 are green in color.
Screen shot from trading view
At “1”, the price of the ETC almost got to the S1 level at $65.9002 before a reversal occurred.
Then at the “2”, a break-out occurred at R1 which still went bullish to R2 at the price of $72.9068 before reversing to a bearish trend.
Going straight to today’s trade we can observe that the main pivot point level is at $65.2395, the trend is bearish because it is below to main pivot point. It is likely to continue in this bearish position till it touches an S1.
It is expected to wait for the price to get the zones before entering a trade.
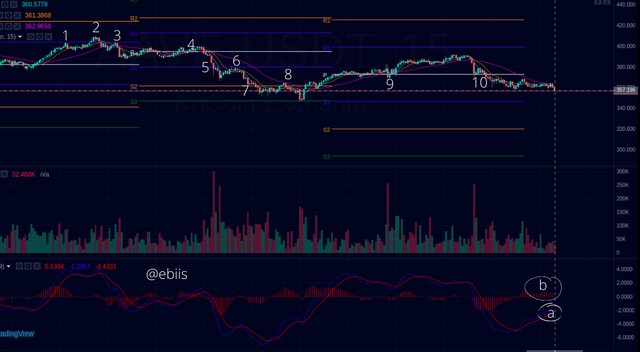
10, Weekly Price Forecast for AAVE/USDT.
The AAVE/USDT Weekly Forecast.
AAVE is a decentralized money market protocol where traders can borrow and lend cryptocurrency. AAVE offers up to 20 cryptocurrencies as collateral. Lenders are rewarded with interest by providing their tokens to the other borrowers.
AAVE’s native token was launched in October 2020. And it has grown rapidly to $361 within a year. This calls for serious concern because it has a high growth rate. Its current market cap is $4,617,993,342, with a market dominance of 0.27%. The current trading volume is $350,201,687 as culled from coingecko.com.
Screen shot from trading view
From the chart above using the Pivot Point Level, within the past week, the main pivot points have been increasing. It moved from $302.362 on the 2021-05-30 to 316.213,358.162, 375.378, 382.712,95.236, and 373.293 on the 5th of June 2021.
Looking carefully at the chart, at “10”, it tends to be bearish because the market direction is moving below the main pivot point. This signifies that the market might continue in a bearish trend if there is a breakout at either the s1, s2 supports.
The pivot point Indicator is a valuable indicator as it gives us a resistance and support levels which can serve as good entry or exit points.
Greed and fear are the major factors that move the market, the pivot points are like a scale for measuring the greed and fear levels of traders on the market.
Thanks
CC
@stream4u
Hi @ebiis
Thank you for joining The Steemit Crypto Academy Courses and participated in the Homework Task.
Your Homework Task verification has been done by @Stream4u, hope you have enjoyed and learned something new.
Thank You.
@stream4u
Crypto Professors : Steemit Crypto Academy
#affable