My submission for week 4 homework task by @stream4u. Here we go:
Homework Task(Topic 1): What Is The Meaning Of Support Can Become Resistance & Resistance Become Support, When and Where set Buy trade, Chart Example?
Before understanding these reversal patterns, brief mention of Support and Resistance is necessary. So here we go
Support represnts a price level where a downward trend is expected to pause. During downtrend as price decreases, buyers increaae and try to halt the downtrend and therefore price is expected to rise. So it represents the point to place BUY order. Support line can be compared to a floor which prevents price from pushing downwards. Support line can be obtained by joining the tops of downward running price peaks.
Resistance represents the point where a upward trend ia expected to stop, which means price of asset is expected to come down. It marks the point where a trader is expected to place a sell order. Resistance can be compared to a ceiling above which price rally runs out of energy and tends to fall back. Resistance line can be obtained by joining tops of uptrending peaks.
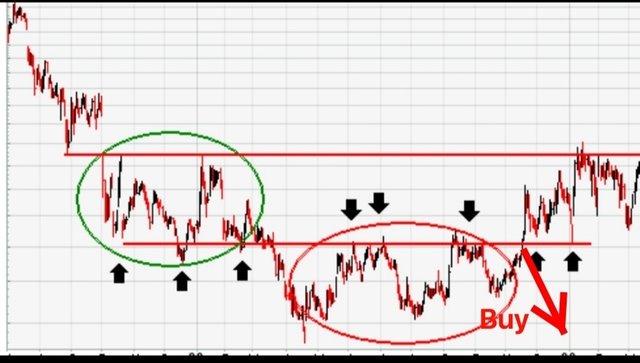
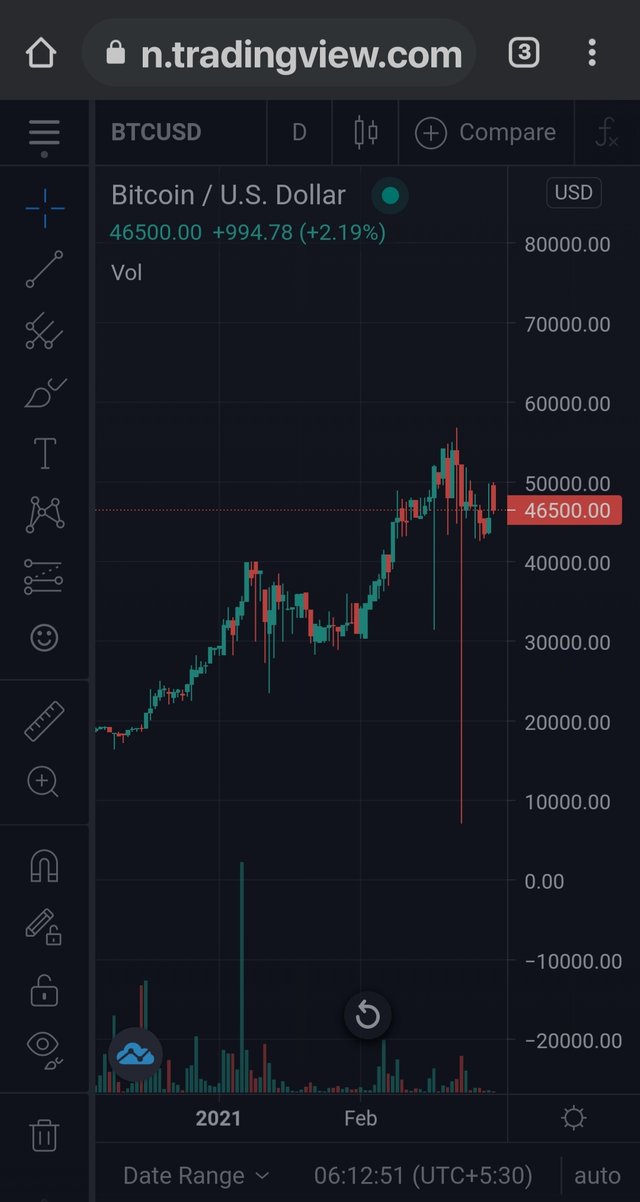
Screenshot from traditional view
R1 - Resistance one.
S1 - support one .
S1 to R2 - support one acts as resistance at 2nd place.
I have also mentioned buy signaal however i am not sure about it.
By saying that support became resistance , it means at that time period price of assets has gone down the previous support level and has maintained a new support level which is lesser than previous resistance and has turned previous resistance into support now.
Suppose any asset say BTC, price over a period of week (say) excluding price breakouts , has tried to remain as high as 49000$ (resistance) and dipped down to 48000$ (supporr). Now what i saw is that price of BTC is fluctuating between 48000$ above and 47000$ below. So the preclvious support of 48000$ is acting as resistance now and a new support level has formed at 47000$.
By saying resistance has become support, it means that price break out has occured above previous resistance level and has maintained new resistance level and turned previous resistantance into support.
Continuing above example, say BTC maintained previous resistance at 48000$ . Now what we see that price hike has occured and BTC is fluctuating between 48000$ and 49000$. It means that previous resistance of 48000$ ia acting aa support now and a new resistance of 49000$ has evolved.
Homework Task(Topic 2): What Ia A Technical Indicator & What They Do?
Technical indicators are trading tools developed by experts based on their experiance in trading. These are developed by looking at history and trading volumes of any asset. They help traders and investors in trade timing and predicting trade trends like whether price of asset will go up or down and therefore help (alert) them in determining where and when to enter and exit.
There are two types of indicators:
Overlay indicators : As name implies, these indicatoes overlay or superimpose over main price chart. Example, Bollinger Bands .
Oscillator indicators : These indicators oscillate around their mid point between upper and lower limits. They determine strength and momentum of trend. Example, MACD.
Examples and explanation of some indicators.
Relative Strength Index (RSI)
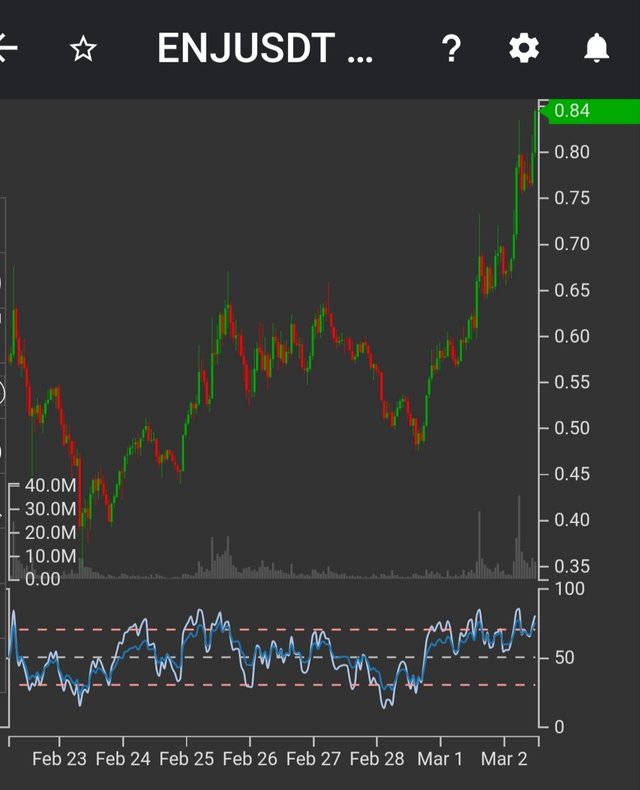
RSI - screenshot from my tradiny account
It is a technical analysis tool that is used to measure whether an asset is overbought or oversold. It is a type of oscillator index with value between 0 and 100 and a mean by default is 50. If the RSI is above 50 , it is considered as bullish or upward trend. If RSI is below 50, it is considerd as bearish or downward trend. However, traders has changed these values to above 70 (overbought) and below 30 as oversold.
RSI helps traders /investors to determine entry and exit points.
Bollinger Bands.
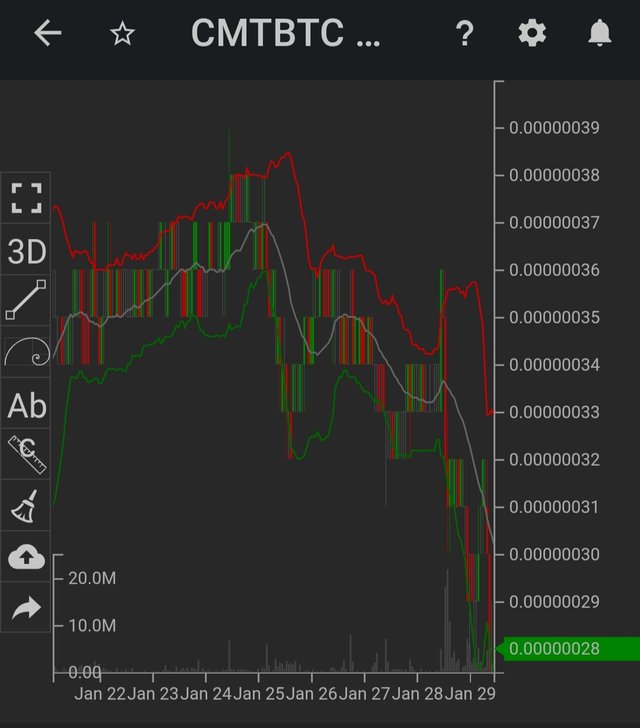 Bollinger Bands - Screenshot from my tradiny account
John Bollinger has developed this indicator. This indicator has 2 bands, upper and lower and a line of moving averages. Upper and lower bands are located 2 standard deviations above and below the moving average. Asset is considered overbought at the top of upper band and oversold at the bottom of lower band. When the bands are squeezed there is low volatility in the market and when the banda are exposed, there is high volatility in the market.
Moving Average Convergence Divergence (MACD)
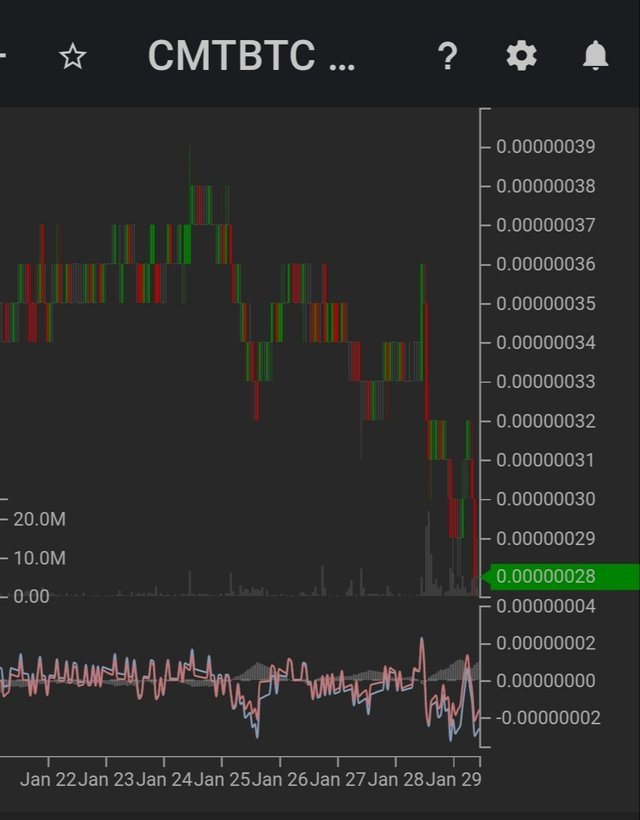 MACD - screenshot from my tradiny account
MACD is combination of two moving averages, long term and short term MA. It is used to predict market trend and change is momentum. To judge market trend, we will have to look at MACD line and signal line. If MACD (blue) line is above average line, market is bullish. Reverse of above indicates bearish trend. Divergence of lines indicate strengthening of current trend and convergence indicates reversal of trend.
Homework Task(Topic 3): Provide your view and explore TradingView.
 screen shot from my tradingview homepage in dark mode
Tradingview is a charting and socialmedia platform for beginners as well as advanced traders. Even without subscribing to any plan that it provides, some of the versatile features like charting, research, and analysis information are available . Tradingview provides bulk of information without submitting to plan like you can search for any stock, idea , script or people. You can create your own watchlist, delete or add entries to your watchlist. You can find stories by top authors or your followers, latest stock news, economic calendar. You can also share your trading ideas, views or experience with others. So the social media aspect of trading view has ita own charm. However, with basic free plan, you won't be provided any customer support and the feature that annoys me and bars me from using tradingview is its single chart layout in basic free plan and even on pro plan, on which explaining things for sake of homework task is not possible. Also one alert with three indicators and only access to one device. Also select brokerages are linked to TradingView at this time.
Homework Task(Topic 4): What is 200 Moving Average, how and when we can trade/invest with the help of 200 Moving Average? Show different price reactions towards 200 Moving Average.
200 moving average is
an indicator to analyse and identify long term market trend. It is a line which shows 200 days closing price. It is used to predict bullish or bearish market. If price of asset is staying above the 200 days MA line, it means market is bullish. On contrary, if prixe is trading below 200 days MA line, market is bearish. It is calculated for any asset by summation of 200 days market price for that asset divided by 200.it is viewed as dynamic resistance and support.
200 days MA is often used in conjunction with short term moving average most commonly 50 days moving average. The separation between two lines shows the strength of the trend. Increasing separation between two lines represent strong market momentum while as converging short and long MA reflects lack of market strength.
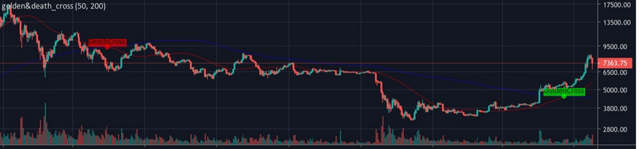
Death and Golden cross Trading view
Third Scenrario of the two moving averages is that when they cross over. When 50 days moving average crooses to downside of 200 days moving average, a cross so formed is known as DEATH CROSS. it indicates an upcoming bearish trend. When 50 days MA crosses above to 200 MA, a cross so formed is known as GOLDEN CROSS as it reflects an upcoming bullish trend.
Above discussion of MA is simple moving average.
Another type of moving averages is known as exponential moving average. Simple moving average as we have read in mathametics that, it is average over a given time frame. Like i mentioned above , summation of averages over a time frame divided by number of days in a time frame.The exponential time frame on the other hand, gives more weight to recent trading days. However, there is not much difference in their practical application.
Thanks
Twitter shared.
Hi @drqamu
Thank you for joining Steemit Crypto Academy and participated in the Homework Task 4.
Your Homework task 4 verification has been done by @Stream4u.
Thank You.
@stream4u
Crypto Professors : Steemit Crypto Academy
https://twitter.com/Qamran7007/status/1367116604098547720?s=20