Steemit Crypto Academy | Homework Task 3 For @stream4u | What is Chart Patterns? | Price Breakout - Continuation Patterns - Reversal Patterns | STOPLOSS. "
This is my submission for Steemit Crypto Academy Homework Task 3 For @stream4u which is about Chart Patterns?
What Is A Chart Pattern? Explain with Candlestick Charts.
Bullish pattern
Bearish pattern
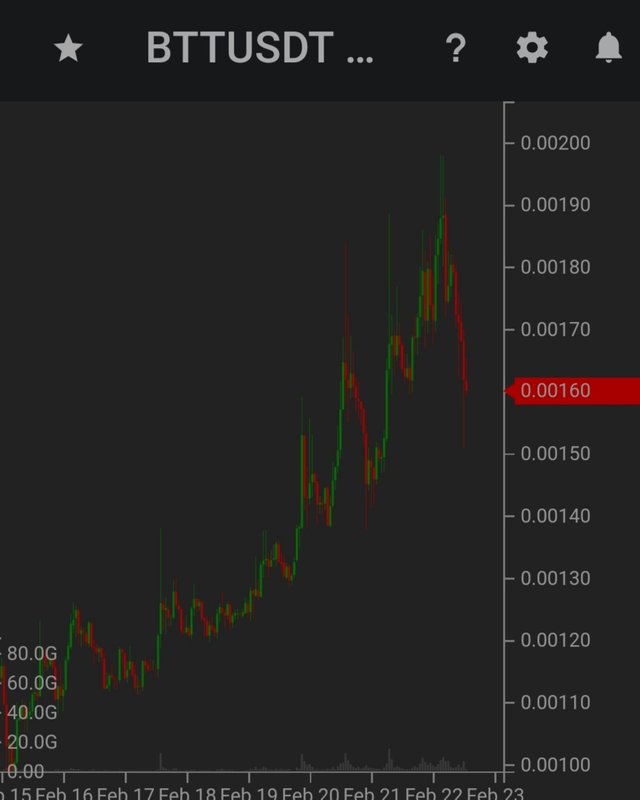
What Is A Price Breakout? Explain with Candlestick Charts and mention the price levels.
price breakout by BTT with price touching 0.00190 USDT
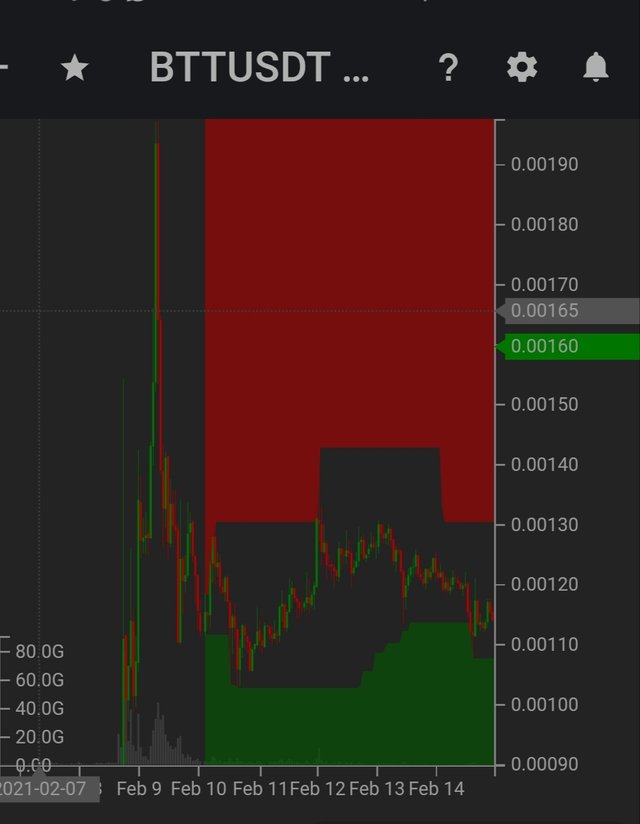
What Is A Continuation Pattern? Explain with Candlestick Charts and mention the price levels.
A continuation pattern is one which is likely to repeat the prevailing pattern. An arbitrary system of continuation pattern suggests that a strong continuation pattern has 3 times more tendency of repeating itself where as reliable pattern has 2 times more tendency and week has 1.5 times more tendency.
Higher high patreen and lower low pattern shown below are examples. See charts below.
What Is A Higher High Formation? (Explain with one of the crypto coin charts where the Higher High Formation identified.)
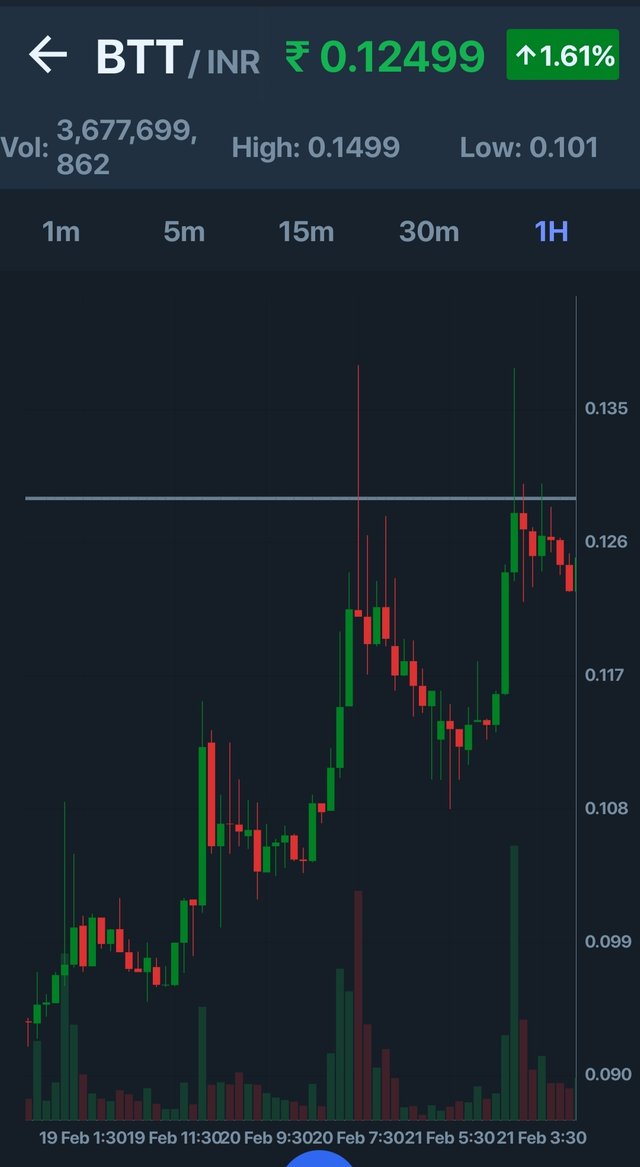
Hugher high pattern of BTT from my wazirx app
Higher high pattern is a chart pattern where subsequent price is higher than cosecutive previous one. It means buyers are in command of the asset.
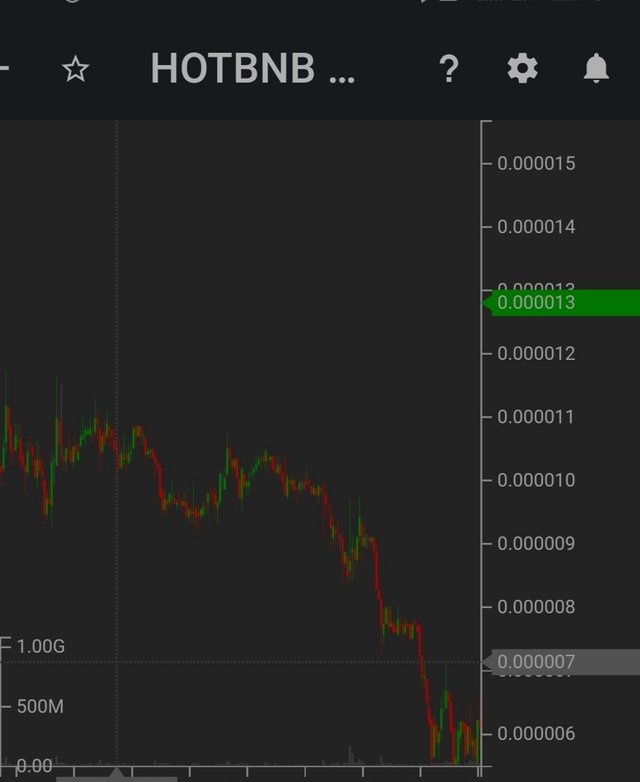
What Is A Lower Low Formation? (Explain with one of the crypto coin charts where the Double Top Pattern identified.)
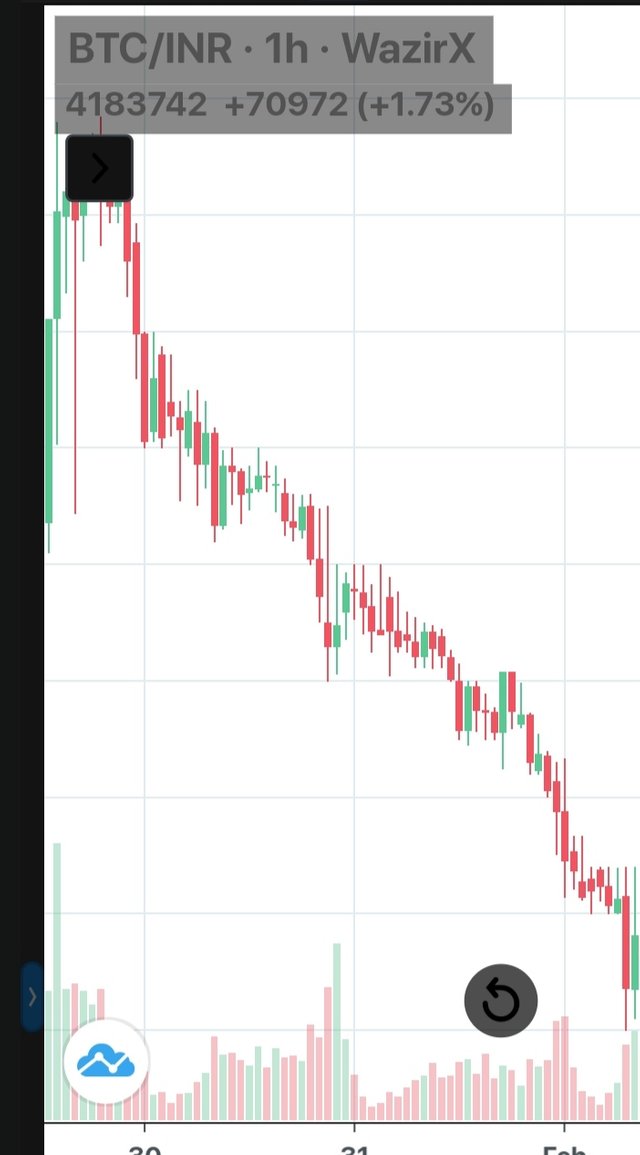
Lower low pattern of BTC from my Wazirx account
Lower low is the pattern of the chart where subsequent price is lower than the previous low. It means sellers are in command of the asset.
What Is A Reversal Pattern?
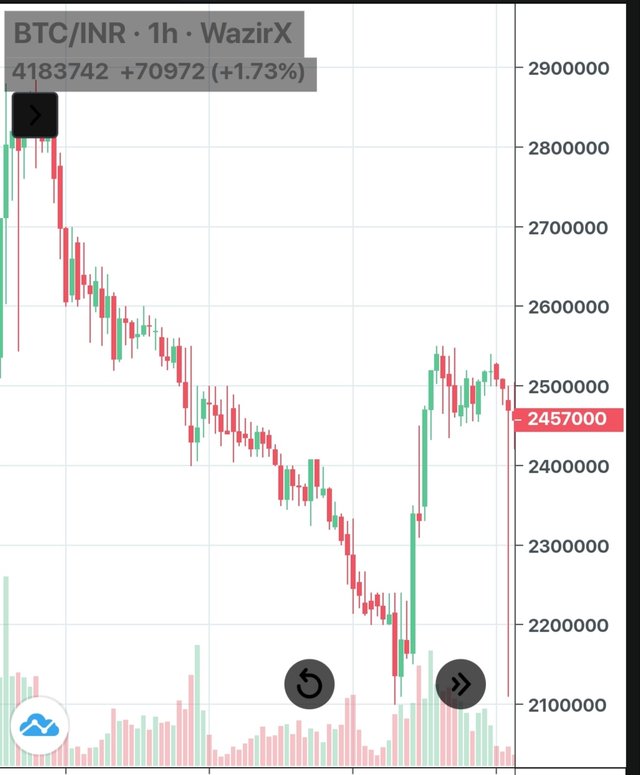
we can see that towards the end the downtrend has begun to change
A chart pattern where a newer trend is not similar to previous trend or we can say that a previous trend is changing to a new trend. In Bearish reversal trend, subsequent highs are lower than previous highs. In Bullish reversal trend, lows are higher than previous lows.
What Is A Double Top Pattern? Explain with one of the crypto coin charts where the Double Top Pattern identified.
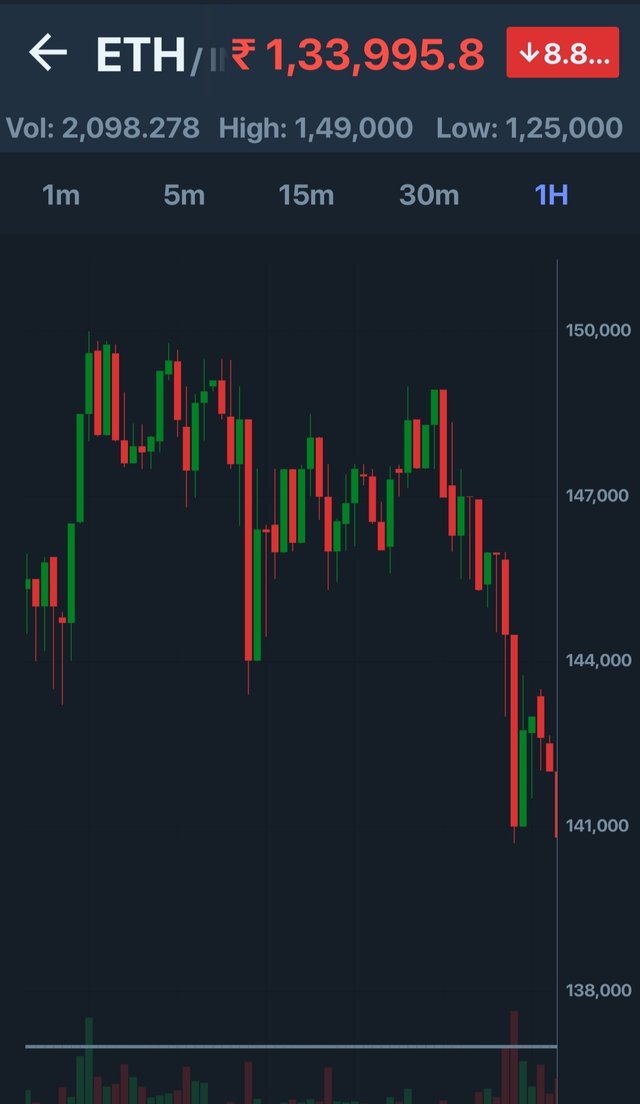
Screenshot of double top trend of ETH from my wazirx
Double top pattern as the name implies is a chart pattern in which two peaks of roughly same price are seen on a chart and are usually seen at the end of a bull market. Double top can be understood as, buyers are dominating till first peak and than sellers dominate causing price to fall. The patrern than reverses. On finding this pattern, those who invested in the asset can exit to avoid loss.
What Is A Double Bottom Pattern? (Explain with one of the crypto coin charts where the Double Bottom Pattern identified.)
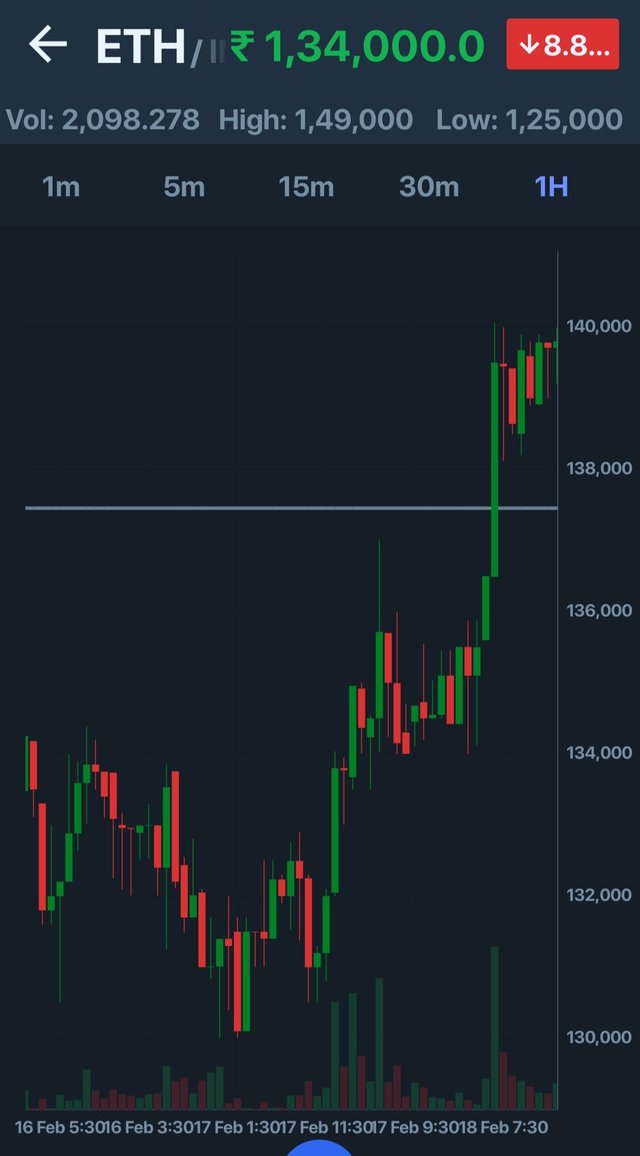
Screenshot of double bottom pattern of ETH from wazirx
Double Bottom pattern is similar to double top but in reverse direction. Here two minima are seperated by a small peak. As price is expected to rise , on sighting this pattern buyers find it as opportunity to enter the market.
In Investing & Trading What Is The Importance of Stop Level(STOPLOSS)?
Stop loss is a type of order set on the basis of asset history to minimize loss and thereby maximizing profit. When used properly, it is a potential tool to save time and money. It relieves one of mental stress because you need not stick to your gadget to keep track of price.
Where To Find & How To Set A Stoploss?
To find stoploss, we must look at asset history to find support level and resistance level. We must look for two to three support and resistance level . Usually second or third support / resistance level is set as stoploss level.
What Understood From This Course?/ Conclusion
This lesson is one more step to empower us technically and progressively make us a good crypto trader. From this lesson, i learned significance of some chart patterns in trading.
Hi @drqamu
Thank you for joining Steemit Crypto Academy and show your participation in the Homework Task 3.
Your Homework task 3 verification has been done by @Stream4u.
Thank You.
@stream4u
Crypto Professors : Steemit Crypto Academy
https://twitter.com/Qamran7007/status/1363895358611279872?s=20
Great explanation brother. I hope you post about "how to read candle stick"