Steemit Crypto Academy Contest / S4W1 - Crypto Market Technical Analysis by @drqamu.
Hello dear friends , hope you are all fine and doing well. We are in week ist of season four of Steemit engagement challange and today I choose to write about a task set by Steemit crypto academy which is about Technical Analysis. Let's begin :

How would you define Technical Analysis in the Crypto ecosystem? Mention its Importance.
Technical analysis is a method of analysing charts of cryptos or stocks to predict the direction of market movement. It is done with the help of past price and volume data of assets under consideration.
Technical analysts have thoroughly studied charts over years and come up with chart patterns, important price levels like support and resistance, trendlines and indicators. Some commonly used chart patterns include double top and double bottom patterns, head and shoulder patterns, flag and pole patterns triangles and penants etc. Similarly, some important levels include static and dynamic Support and resistance and trendlines etc.
These structures are manifestations of the psychology of traders and we know the psychology of traders involves some factors that are inherent to human beings and keep on repeating over time. So technical analysts explore these chart patterns or levels and materialize them.
Technical analysts have developed various indicators based on various parameters of cryptocurrencies like price /volume and volatility etc that are used to predict the price movement of assets to be materialised.
Importance of Technical Analysis
Help in predicting future market movement to be materialised.
Help in the identification of signals like entry and exit points.
Help in devlpomg a proper trading system with a specific risk-reward ratio so that with above average win rate traders remain in profit.
Help in understanding market psychology.
Technical analysis is very important for short-term trading like intraday and small duration swing traders.
Do you have practical knowledge of how to conduct technical analysis? Highlight some of the components of Technical analysis.
As I am in crypto trading for more than a year now and all my trades are based on technical analysis. As such technical analysis is an umbrella term and has diverse components to analyse. So the important components of technical analysis include price charts, volume and price, indicators, chart patterns and important levels like support and resistance etc.
Charts
There are different types of charts like line charts, bar charts , Heikin-Ashi Charts and JC charts etc. The most commonly used chart types in technical analysis are Japanese candlestick charts. They are the most popular type of chart used nowadays.
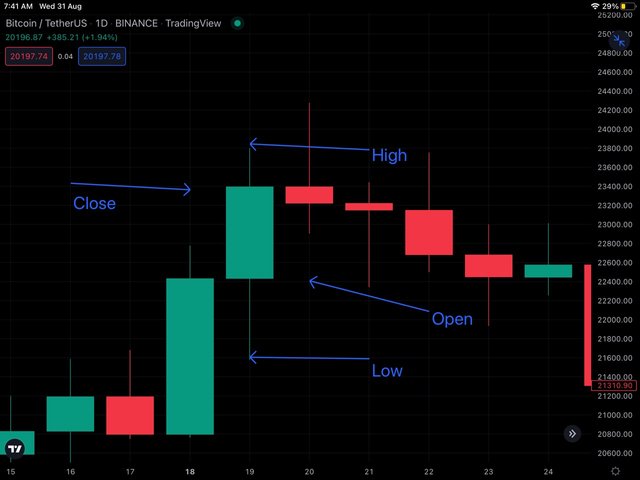
A Japanese candlestock chart is shown above , a candle showing OHLC is highlighted
In JC charts each candle has four price points are they are open, High, low and close. The open and close form two ends of the real body whereas high and low are represented as wicks above and below the body. These charts are most informative and simple to interpret.
Price and volume
The price of an asset over a particular time frame for a particular period helps in understanding whether the price of an asset under consideration is increasing or decreasing. If the price of asset is increasing we can look for a buy position, on the other hand, if the price of an asset is decreasing we can look for a sell position.
Similarly, the volume of an asset represents the number of shares or tokens traded over a particular time frame. The interplay of price and volume can help in understanding the market. If price of an asset is increasing with the increase in volume it means buyers have taken control of the market and signals bullish sentiment in the market. Similarly, if the price of an asset is decreasing with the increase in volume, it means sellers have taken control of the market and signals a bearish sentiment in the market.
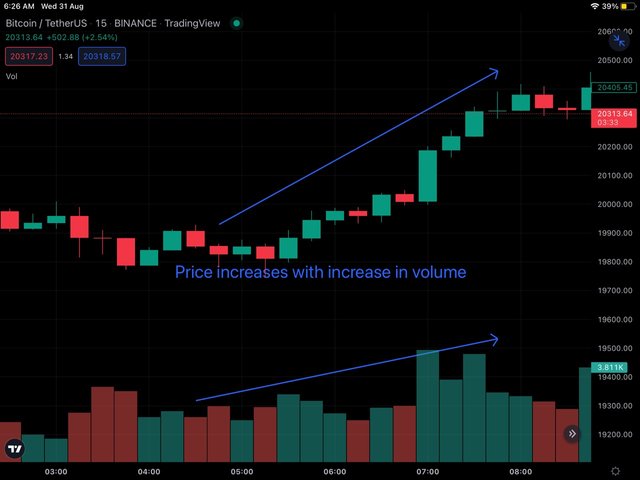
in the screenshot above, price increases with increase in volume indicates that there is buying pressure in the market
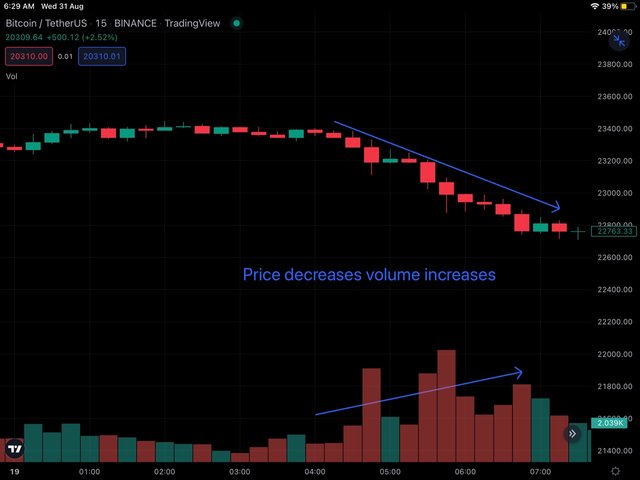
in the screenshot above, price decreases with increase in volume indicates that there is selling pressure in the market
Chart Patterns and Levels
Support and resistance are important levels on the price charts that represent areas of increasing demand and supply respectively. Support is a price level from which decreasing price of an asset is expected to pause and bounce back on the other hand resistance of an asset is a price level where the increasing price of a assest is expected to pause and bounce back.
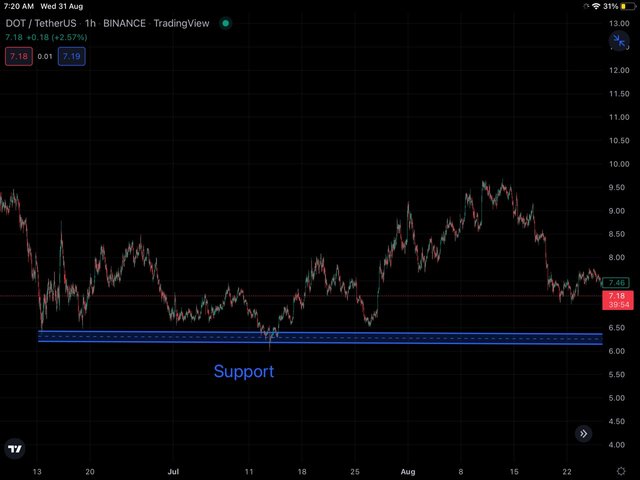
in the screenshot above, static demand zone or support zone is marked that pushes price up everytime it reaches support
At support there is a consolidation of buyers and therefore marks an area of increasing demand and pushing the price up whereas at resistance there is a consolidation of sellers and therefore marks an area of increasing supply and push the price down.
Similarly, we have uptrend and downtrend lines that represent areas of dynamic support and resistance respectively. We call these levels dynamic support because the price keeps on taking support and form higher high levels and dynamic resistance is met from a downtrend line as the price keeps on making lower lows.
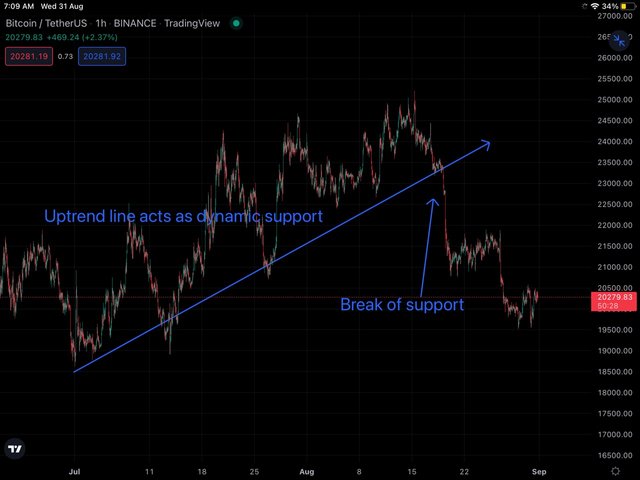
in the screenshot above, an uptrend line marks dynamic support and price keeps on making higher highs until the line is broken and price started falling thereafter./sup>
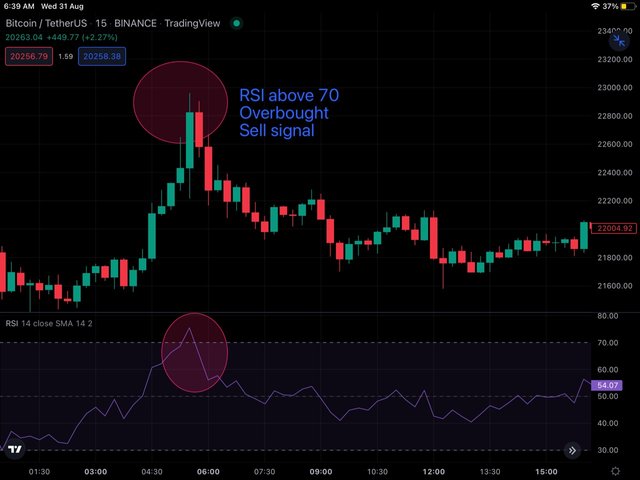
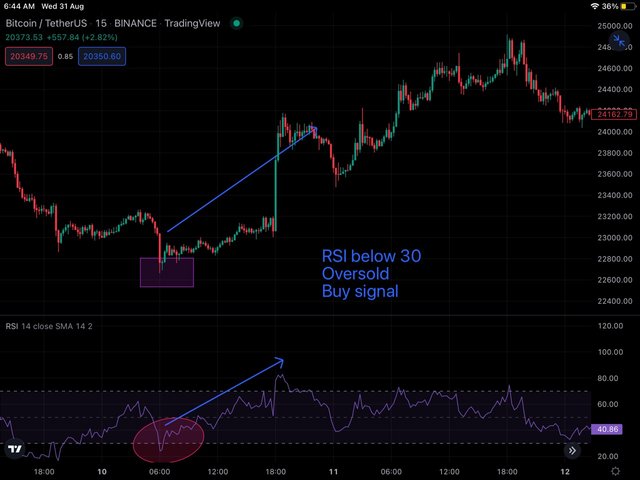
With experience, we can identify different chart patterns and materialise them based on prespecified levels like the break of a neckline in a double bottom or double top pattern activates entry for buy and sell signal respectively. Technical analysis indicators are developed based on market data like price, volume, momentum, volatility etc and generate signals to be materialised. Indicators have been discussed below. Technical indicators are tools generated based on historical data of cryptocurrencies like price, volume, volatility etc to give information about various trading parameters like : It doesn't mean that every indicator will tell us about all these parameters but different indicators have different specifications and roles to play. As for the location of indicators on the chart is concerned, there are two types of indicators and they are : Overlay indicators: As the name implies, these indicators overlay or superimpose over the main price chart. For example, Bollinger Bands, Moving averages, Alligator indicator etc Oscillator indicators: These indicators oscillate around their midpoint between upper and lower limits and are placed below the chart. They determine the strength and momentum of the trend. Examples, are MACD, RSI, Stochastic RSI etc. Although technical analysis indicators are often developed by experienced traders based on their understanding of the market. As for my strategy is concerned, I am a trader and make use of indicators occasionally for supportive purposes. I believe it's never possible to execute trades based on an indicator. Execution of trade has to take place always based on chart and indicator has a supportive tole. So do not rely solely on Indicators. As for my favourite indicator is concerned, I would say RSI ( Relative Strength Index) indicator is my favourite indicator besides moving averages like 200EMA. Let's briefly discuss the working of RSI. RSI ( Relative Strength Index) is an oscillator-type of technical analysis indicator that is used to measure the momentum of an asset under consideration. RSI value arranges from 0 to 100 with a mean of 50. When RSI is above 50, it indicates an uptrend whereas when RSI is below 50, it indicates a downtrend. RSI is used to give an insight about an asset whether it is overbought or oversold. An RSI value of above 70 indicates that an asset is overbought and is likely to fall. Similarly, an RSI value of below 30 indicates an asset is oversold and is likely to show a price increase.Buy and sell signals can be found on charts corresponding to oversold and overbought points respectively. in the screenshot above, RSI value is greater than 70 which indicates that the Bitcoin is overbought which gives the sell signal followed by fall in the price of Bitcoin. in the screenshot above, RSI value is lesser than 30 which indicates that the Bitcoin is oversold which gives the buy signal followed by increase in the price of Bitcoin. Besides the above-mentioned information, RSI divergence is another concept to be kept in mind. Divergence as the name implies refers to division in the direction of RSI compared to the price. There are two types of divergencies seen on RSI. Bullish divergence : When the price of an asset is going down whereas RSI is going up, it indicates the forthcoming trend change and signals that the price of asset is going to increase and is, therefore, a buy signal. Bearish divergence: When the price of an asset is going up whereas RSI is going down, it indicates the forthcoming trend change and signals that the price of asset is going to decrease and is therefore a sell signal. Advantages of Technical Analysis Technical analysis helps traders in taking quick trading decisions like entry and exit points. Technical analysis help in predicting trend change and therefore alerts traders in advance. Technical analysis help traders in identifying strength and weaknesses of trend and therefore help traders to make decisions like holding or squaring off. Technical analysis helps traders in developing a profitable trading strategy and do backtesting before applying it in the real market. Technical analysis help in understanding the sentiment of the market based on the psychology behind the formation of various chart patterns. There is no certainty in any signal generated. Despite the perfect use of technical tools, no one can predict any move with 100% accuracy. So a trader must have a proper risk reward strategy in place. Technical analysis as the name implies demands technicalities and isn't therefore an easy learn. There are scores of indicators and strategies available and traders are often confused about what and when to use them. Keeping all the advantages and disadvantages of a Technical analyst in view my advice would be to learn it properly before applying it in the real market. Moreover, an equally important component to be mustard before entering into real trade is that of risk-reward management along with trading psychology. So master all these aspects of Technical Analysis only then we should put real money into the market. There are various types of analysis like fundamental, statistical, sentimental and technical analysis. Just like other analysis, technical analysis has its pros and cons. Fundamental analysis is of more use for investors whereas technical analysis plays a more important role in short-term trading.What do you understand by technical indicators? Do you consider them effective for trading cryptocurrency? Which one is your favourite and how does it work? (Screenshots required where necessary)
Highlight the advantages and disadvantages of technical analysis. What's your advice to anyone about it?
Disadvantage of technical analysis.
Conclusion
Honestly, I must say that I really enjoyed reading through your post. You have written so well about technical analysis and technical indicatiors in a very simplify way. Best of luck to you.
It is pleasure to hear that i was able to convey the asked task to audience in an easy to understandable manner. Thanks for your feedback .
Agreed. But it's always a wise decision to use some indicators to confirm your decisions.
A lot of things come in handy while trading and for me indicators are on the priority list. Although it could be different for you, but that varies from trader to trader
Different traders have different strategy to trade and i have shared my experiance and opinions.
I appreciate your time and interacting here . Thanks
The study of technical Analysis chart is very pure for everyone to study and understand making decisions.
Understanding the sentiment of the market is one of the thing that makes me to love technical analysis. You have absolutely written well. Thank you for sharing your post with us.
Yes you rightly pointed out that Tech Analysis and sentiment are important to understand.
Thanks for being there .
Good afternoon friend,
Yea, that's one major hindrance or downsides of technical analysis because you need special knowledge to be able to successfully make use of this trading technique.
At times it's also expensive to learn especially in my country, here we pay at least 40 thousand naira to receive tutorial on crypto trading with technical analysis. The minimum wage of my country is Thirty-five thousand naira, so therefore it worth more than so many months Salaries.
Thank you very much for sharing
wishing you success.
Actually it is same here . For one course i paid 25 K INR which is more than 132000 Naira.
Thanks for valuable feedback .
The importance of technical analysis to traders can't be overlooked, as it help traders to Know the current sentiment of market participants. I equally love trading with shorter timeframes as it tends to generate more profits. Thanks for sharing such a detailed and educative post, goodluck in this contest.
Actually the selection of time frames depend on trading type for example intraday traders have to trade with 5 min , 15 min and square off with profit /loss in a day
Similarly positional traders would go for weekly to monthly time frames .
Good to hear that you are making good profits .
Thanks for your valuable feedback .
Hello. Sir
Greetings...
It's a great pleasure reading from your entry. And I must recommend..your entry is 90% coverage of technical analysis.
I love the way you put you points and explained.
I use this aspect of technical analysis to review market trend and Know exactly the market direction with the help of indicators
For my trading.
I love your work and wish you good luck in the engagement. Pls link me up here as well
I appreciate your time and valuable feedback.
Yeah very true, technical analysis should be done several times on past market before trading current trend with your strategy. We should always backrest our strategy before using it in our trading.
Volume plays important role in strength of the market. As you said, increased in price with increasing volume is a strong buying momentum and decreased price with increasing volume is a strong sell momentum.
RSI is a very simple and understandable indicator that spot signals like oversold and overbought for trend reversal. I do mostly use RSI with MA and kumo cloud, but my favorite is the Ichimoku cloud.
Please find time to visit my post as well. Good luck!!
https://steemit.com/hive-108451/@sadiqxylo/steemit-crypto-academy-contest-season-4-week-1-crypto-market-technical-analysis-by-sadiqxylo
That's true . In real market with real money, psychology has a great role to play .
Thanks for your valuable interaction .
You’re welcome