Hello friends, hope you are all fine. Today i am writing homework task for professor
@fendit , which is about Elliott Wave Theory. The topic has been very well explained by professor. So let's begin this task.
Pixabay
Share your understanding on this lecture by answering the following questions:
What's the application of this theory?
Elliott Wave Theory (EWT) is a technical tool for traders to analyse movement of an asset's price and on the basis of that movement, traders anticipate future trends and thereby help them to decide where and when to enter or exit from the financial market.
EWT was developed by Ralph Nelson Elliott on the basis of his long term analysis and experiance of financial market. The crux of this theory developed by proposer believes that the market trends are determined by investor's psychology and sentiments. Without carefully analysing one may feel, how market trend is related to psychology or sentiment. Let me give an example to make it clear , what impacts does investor sentiments or psychology has on the price of any asset.
In 2014 , Mt GOX suspended its operations for sometime citing reason of suspicious activities on exchange and that news lead to decrease of BTC price by 20% because it was major stakeholder of BTC at that time. So it was that scary news of security breech that created negative sentiments in the market and traders srarted massive selling of BTC at cheap price and thereby pulled price of BTC down. But later some optimistic investors again put their faith ( sentiment) on BTC and started buying and pulled BTC's price back. Now let me try to bring it more close to our homework by taking our own example.
When do we enter into market and when do we exit. The answer is very simple, we enter when price of token we wish to hold is low and we exit when price is high. In both scenarios, we consider having gain and avoiding loss. This depicts our psychology and sentiments. Similar investor psychology and sentiments had been extensively studied by Ralph Nelson Elliott and represented technically in the form of waves known as impulse and corrective waves.
What are impulse and corrective waves? How can you easily spot the different waves?
What are your thou
Impulse and corrective waves are graphical representation of price movement and market trend dynamics of an asset signifying different things, which we shall discuss below.
IMPULSE WAVES
Impulse waves refer to those waves in 8 wave market cycle which are in the direction of market trend. The point to understand here is that , impulse waves can be seen in bullish market as well as in bearish market, but in opposite directions. To simplify in bullish market as price of asset is going upwards, the impulse waves will also be directed towards the same direction. On the contrary, in bearish market as the price of asset is decreasing, the impulse waves will also be directed in downward direction. In 8 wave market cycle, 5 waves are impulse.
If we carefully analyse these waves, we find that, even these 5 waves have subwaves. Two of them are opposite to target trend but retracement is very small compared to preceding wave and remaining three are motive waves ( real impulsive - bullish in bullish market and beeaish in bearish market). The two small against the trend waves are not strong enough to reverse the market. So the net movement of market is in the direction of trend.
Corrective WAVES
Corrective waves refer to those waves in 8 wave market cycle which are in the direction opposite to that of market trend. Impulse waves are seen in bullish market as well as in bearish market, but in opposite directions. To simplify in bullish market as a price of asset is going upwards, the corrective waves will be directed opposite to the trend. On the contrary, in bearish market as the price of asset is decreasing, the five impulse waves will also be downwards but the three corrective waves will be upwards
What are your thought on this theory? Why?
As this question ask me to present my thought regarding this theory, so i may or not be correct, but I have to present my opinion . So here it is:
I think EWT is not absolute just like other indicators. In my opinion it represents one particular Trend in the market and that trend to which I can correlate it is, "higher high" in bullish market and " lower low " in bearish market. As for my experiance is concerned, i find it very difficult to spot the exact trend in the market but if we analyse it in broader perspective, than it works perfectly well because whatever the pattern of price that an asset is made to follow by investors, general trend remains the same and that is decrease in price is followed by corrective back pull and vice versa.
So the bottom line is that, this principle is reliable to follow in concordance with orher indicators like support, resistance, RSI, MACD etc but not individually.
Choose a coinchart in which you were able to spot all impulse and correct waves and explain in detail what you see. Screenshots are required and make sure you name which cryptocurrency you're analyzing.
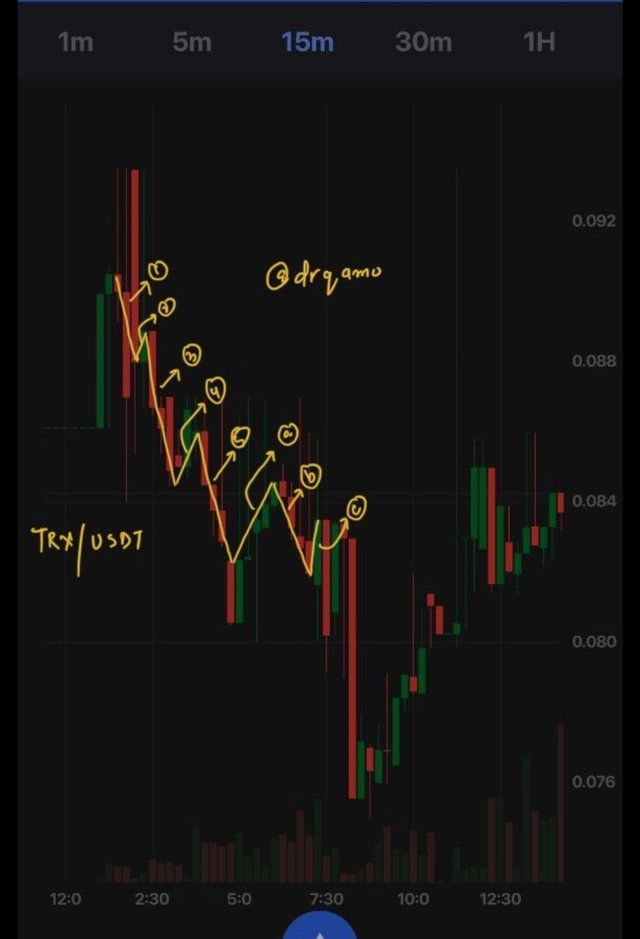
TRX/USDT in bearish market from my wazirx account
Fact Check
EWT has three unbreakable rules which must not be compromised. Let's analyse, if my graph shown above, follow these rules:
Rule ome
Wave two cannot retrace whole length of the first wave
Wave 2 above is much smaller and does not retrace whole length of wave one. So rule one is obeyed.
Rule two
The third wave has to be longest of waves one, three, and five.
Yes wave three is longest among one, three and five.
Rule third
Wave four can't go beyond the third wave at any time.
Ofcourse wave four doesn't go beyond third wave. So rule is obeyed.
So we analysed that bearish impulse waves took price of TRX down from 0.090 USDT (approx) to 0.081UEDT and than the corrective waves pulled up the price from 0.081 to 0.083 USDT.
Let's try to analyse the waves separately. So let's start from impulse waves.
- Wave 1: As for our analysis of market cycle is concerned, it marks beginning of the cycle, people started selling TRX , which means that they are selling to avoid forthcoming loss .
- Wave 2: There is a small back pull in the price of TRX because some of the traders bought TRX on seeing price drop. They may be planning to hold and sell later once price correction occurs.
- Wave 3: As per rule , this wave can't be shortest of wave one, three and five. Here huge chunk of people had understood that price is dropping and they too sold TRX ro avoid more loss. So it caused significant decline in TRX price.
Wave 4: Just liken wave 2, the price will reverse a little bit. It may be due to some investors trying to take advantage of low TRX price and bought TRX.
Wave 5: Last phase of price decline caused by bearish traders further selling TRX. This phase is than followed by corrective price change.
Well detailed presentation. Easy to understand. Thanks for sharing us.
Best of luck.
#affable #india
Thank you very much.
Thank you for being part of my lecture and completing the task!
My comments:
Nicely done!
There were a couple of paragraphs in the first task that was kinda hard to get through, always remember that's always better to write it as simple as possible (without being brief or not explaining things properly) so that everyone can understand it. A good way of making it simple is by asking yourself if someone that doesn't know anything about the topic can fully understand it!
I really liked the second task, very nicely explained and well-proved that the three unbreakable truths were applied!
Overall score:
7/10
Thank you sir. I'll try my best next time to act upon on advices.
#affable