Hello friends today i am going to write homework task for
@kouba01 which is about one of the oscillator index RSI. The lecture delivered by professor is comprehensive as usual and the way of explaining is adorable. So let's begin the task:

What is the Relative Strength Index - RSI and How is it Calculated?
Relative strength index is a technical momentum indicator developed by Willis Wilder . It is basically a trading tool like many other technical indicators. To be more specific, it is an oscillator indicator like MACD (Moving Average Convergence Divergence ) . The other type of indicators are known as overlay indicator like bollinhger bands.
RSI is used to measure whether an asset is overbought or oversold and thereby help traders in spotting buy/sell signals. Its value ranges between 0 and 100 and a mean by default is 50. If the RSI is above 50 , it is considered as bullish or upward trend. If RSI is below 50, it is considerd as bearish or downward trend. For spotting overbought and oversold signals, values have been changed to 30 and 70 (Mean +/- 20) . If RSI is above 70 ,
it indicates that an asset is overbought and if it is below 30 , it signifies that an asset is oversold.
Calculation of RSI.
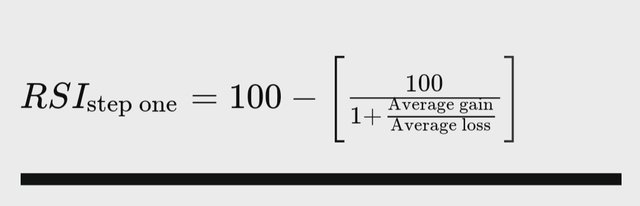
Multiple formulae are used to calculate RSI. Let's have a look at one.
source
RSI calculation formula
In the above formula, we need to understand the concept of "Average". Technically speaking, average refers to "summation of individual entries divided by number of entries". In layman language if we try to understand the concept of average, we can put it like this. Suppose A is doing a business, he earned profit of 50$ on day one, 60$ on day two and 90$ on day three. Another person X asks him, his average profit for 3 days. For him average profit will be 100$. Do you know how?. Let me answer. He had total profit of 300$ in 3 days. For average he has to divide it equality into 3 days. So it comes 100 per day. Mathematically, we can calculate it as, "sum of entries divided by number of entries ". That is 50+60+90/3 =100. Same holds true for loss.
Let's take example of crypto now. As we know that there are 14 units taken by default for calculating RSI. Suppose BTC performed well for 7 days in a week and at the end the average profit is 2% and for rest it performed poor and resulted in average loss of 1.6%. Applying this data, into above equation of RSI.
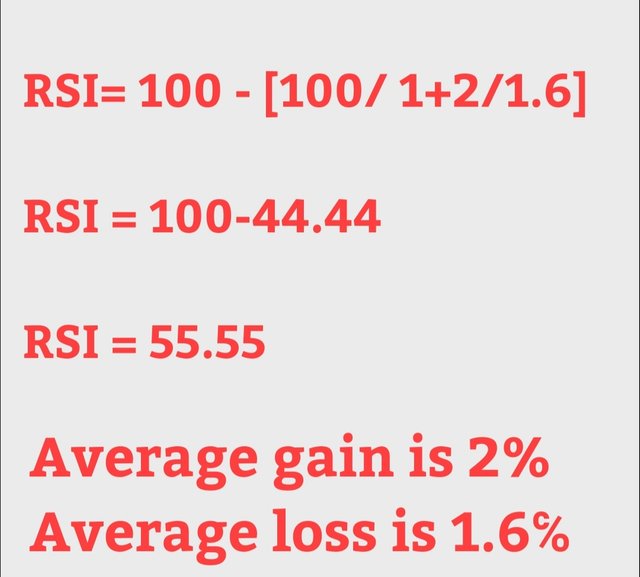
In above example, as RSI for BTC came out to be 55.55 which is above median. So RSI graph would be going up and therefore indicates bullish trend. Had it been 70 , we would have understood it as overbought asset.
Had RSI been lower than 50 , RSI graph would have come down and therefore indicating bearish trend. Had it been 30 or less, we would have called it oversold asset.
Can we trust the RSI on cryptocurrency trading and why?
I would say, nothing is absolute in universe. Pros and cons are inherent to everything. So holds true for RSI too. If combined with other indicators and a good trading experience, it is a trustworthy indicator. It has been seen that in a fluctuating market, RSI at times continues to stay in overbought or oversold zone and can give rise to false positive or false negative signals, that is the reason, it must be supported by some other confidence factor or indicators like STOPLOSS , support, resistance etc.
Least not the last point, i would mention is that at times variations are seen among the indicators like RSI and MACD. Let me say how, RSI may be in oversold (<30) zone giving a buy signal while MACD may be showing selling momentum is still there. The point to emphasise here is that, although both are good momentum indicator but none is absolute. So using them in concordance with other confidence factors would be a sane practice to adopt.
How do you configure the RSI indicator on the chart and what does the length parameter mean? Why is it equal to 14 by default? Can we change it? (Screen capture required)
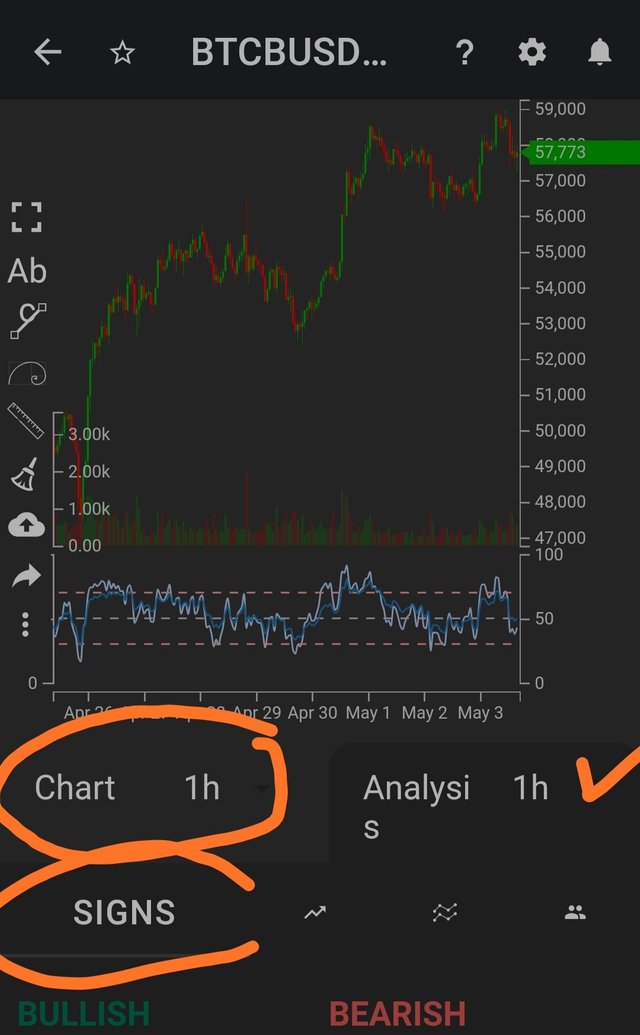
I will be describing it with the help of my tradiny app. Once you log into the app,
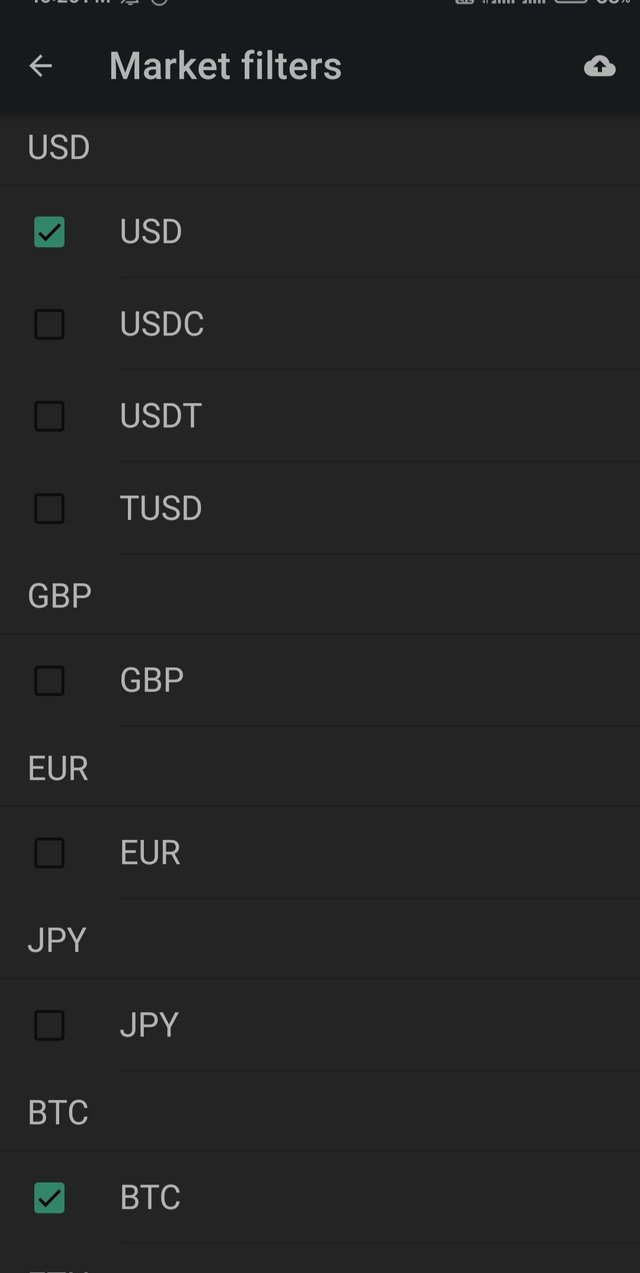
Click on top left corner to select the assets you are looking for.
Suppose BTC/USD. Tick both the assets.
Than go to main page where chart will be loaded automatically.
Just below the chart, there is heading by the name of signs. Click on it and list of signs will be loaded. You can also make a search. Let's say RSI.
Once RSI is selected, RSI graph will be loaded instantly below the price chart.
Configuration of RSI.
Length
Length is the most important parameter of the RSI chart. By default, the length of RSI chart is 14 units. The amplitude of RSI depends upon time unit selected. For example, in a 1h time frame, RSI formed will be shown for 14 hours. If 1 day is selected, RSI of 14 days will be formed.
Length and other configrtation factors like font etc are not available on free version of tradiny, for that we will have to go for premium.
For sake of completion, the other parameters in configuration include, choosing price of RSI. By default, it is closing price that is there on chart often. However, it can be manipulatd as per traders convienence to opening, closing or lowest price as well.
The RSI value ( 30 , 70) and precision level can alos be changed as per trader's needs.
How do you interpret the overbought and oversold signals when trading cryptocurrencies? (Screen capture required)
As far RSI is concerned, if
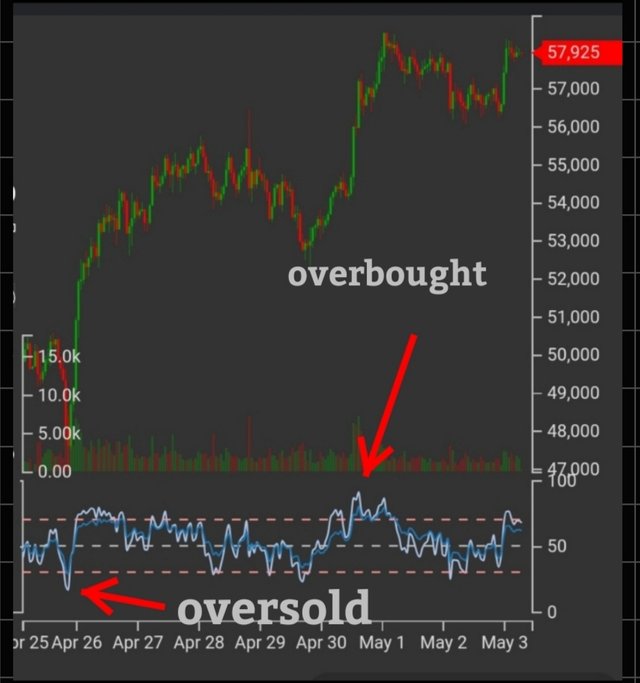
RSI is above 70 , it indicates that an asset is overbought and if it is below 30 , it signifies that an asset is oversold. Let's look at screenshot below:
Screenshot from
my tradiny account
In screenshot above, i have marked and labelled RSI graph at two point. First, look at arrow at 25 April, where RSI value is touching 30 and therefore indicates oversold signal. Another marking is at April 30, where RSI touches 100 and therefore indicates overbought .
.
How do we filter RSI signals to distinguish and recognize true signals from false signals. (Screen capture required)
As i mentioned earlier, no indicator is absolute. in case of RSI false signals can arise, when there is significant price change of an asset in either direction. To spot out these signals, many techniques are being tried and one such concept is divergence in RSI. It can be bullish divergence or bearish divergence.
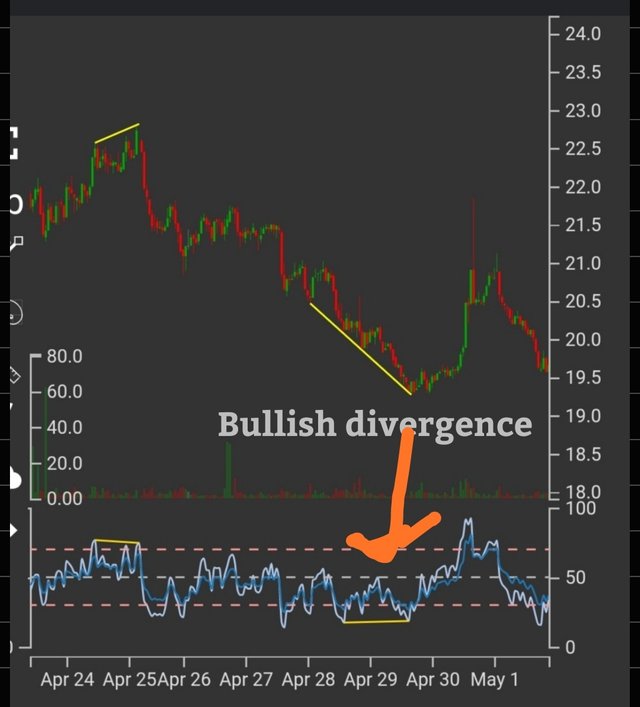
Bullish divergence screenshot from my tradiny account
In bullish divergence, the price of asset keeps on falling (bearish) giving rise to a famous pattern known as lower low ( next low is lower than previous low). But when we look at RSI pattern, it gets stuck at higher low. It is referred as bullish divergence.
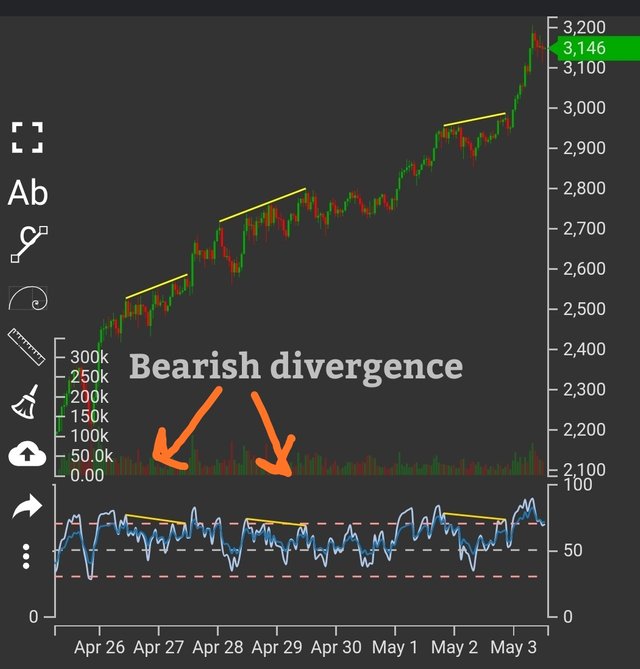
Bearish divergence screenshot from my tradiny account
In bearish divergence, the price of asset keeps on rising and makes another famous pattern known as higher hgh (subsequent high is more than previous high) but when we look at RSI , it gets stuck at lover high and this is known as bearish divergence.
So the point to mention about bullish and bearish divergences is that , both of them are indicators of price reversal . So if we can spot then, we can actually prevent loss and secure more gain out of trading. These divergences signal us that, price correction is imminent and therefore take advantage of the pattern.
Another strategy to filter or lessen the false signals is to be more lenient in selecting periods in RSI. A 14 period RSI will have lesser false signals than a 10 or 5 period RSI. The concept is that, lesser the periods more the false signals.
Least but not the last measure is to look at RSI in concordance with other momentum indicators like MACD. Trading professionals have put forth some interesting generalisations in this regard. If we look at both MACD and RSI and we observe that MACD is showing bullish trend and RSI hovers around 70 , don't sell your position. If we look at RSI alone, then we should expect, corrective price changes to happen next. So to secure maximum profit, we will have to sell but when borh indicators are taken into consideration, we need not sell our position. Similar generalisation has been made for bearish trend too.
Review the chart of any pair (eg TRX / USD) and present the various signals from the RSI. (Screen capture required)
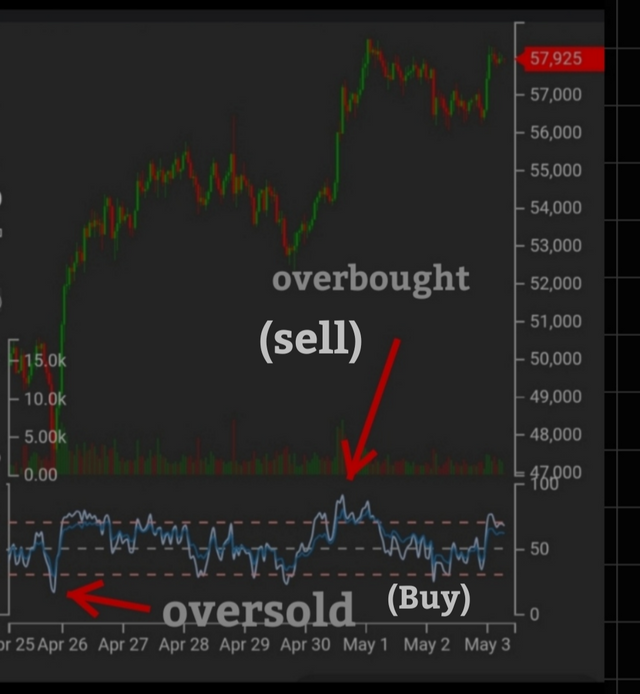
BTC/USDT from tradiny
Above screenshot has been taken from my tradiny account. On 25 April, BTC RSI touches 30 , it means oversold asset and therefore is a signal to buy. On 30 April, RSI touches 100 , it depicts overbought asset and is signal to sell.
To avoid repetition, bullish and bearish divergence signals have been shown above in screenshots.
Conclusion
To aid traders in predicting trade timing and trends, experts have developed certain indicators. RSI being one of them. RSI is an oscillator momentum indicator that help traders in detecting overaold and overbought signals and thereby place buy/sell orders. When combined with other indicators , RSI can be a good tool in hands of traders.


Hello @drqamu,
Thank you for participating in the 4th Week Crypto Course in its second season and for your efforts to complete the suggested tasks, you deserve a 10/10 rating, according to the following scale:
My review :
An excellent article in which you did well to answer all the questions without exception. Regarding the question of distinguishing between true and false signals, you suggested a solution :
Thanks again for your effort, and we look forward to reading your next work.
Sincerely,@kouba01
That is true sir. It is just an example there.
Other indicators that i mentioned sir.
Thank you very much sir.
Project Affable [An Engagement League to empower 2nd, 3rd Layer engagement] in Steem Blockchain is running now for the month of May'2021.
Using #affable tag in your comment will enable you as a willing participant. However, you should remain active throughout the month to comply with Active Participant Criteria. To know more about relevant tags, rules, active participants criteria, etc please CLICK HERE.
What about #onepercent #twopercent
Congratulations drqamu for such a great rating...I read your post you write everything very well..keep going.
#affable
That is great to hear and thank you for going through.
#affable