A pivot point is a technical analysis indicator mostly used by intraday traders to predict the market trend and therby help them in trading.
Details about Pivot Point
A pivot point is a static indicator which means that it remains at particular price level throughout the trading session unlike oscillators or Moving averages that keep on moving. A pivot point for a day is basically average of high, low and closing price of previous day. A pivot has certain levels of support and resistance associated with it, that are calculated on the basis of main pivot point.
The concept of pivot point is simple.if the price goes above pivot point, it indicates bullish market and if it goes below the pivot point , it indicates bearish market. Based on main pivot point, different support levels (S1, S2, S3) are calculated and plotted below pivot point and different
resistance levels (R1, R2, R3) are calculated and plotted above pivot point. These levels help traders understand and predict different levels of support and resistance in case price crosses one level.
Pivot Point Calculation and R1 R2 S1 S2 Pivot Levels Calculation.
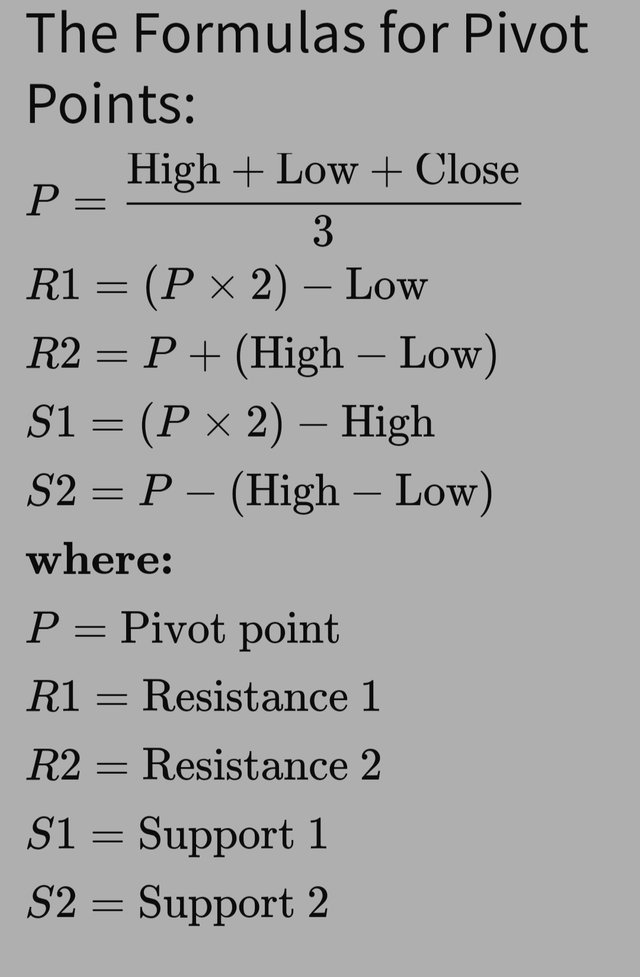
Pivot point is calculated by taking average of previous day high, low and closing price. The support and resistance levels are deserved from pivot point as below :
Source
P = Main pivot point - it forms the hallmark of the pivot point indicator from which other points are drawn.
S1 : First level of support below P .
S2 : Second level of support below p and one level below S1.
R1: First level of resistance above p.
R2 : second level of resistance above p and first level above R1.
Calculatiion of pivot points.
Let's suppose price of DOGE (hypothetical price) coin closed at $3 but in between it had made high of $4 and a low of $2 . Let's try to analyse different pivot levels.
Main pivot (P) = HIGH +LOW + CLOSE DIVIDED BY 3
P= 4 +2+3/3 = 3
So the next day P will be at 3 .
S1= (P x 2) - High
S1 = (3 x 2 ) - 4
S1= 6 - 4 = 2
S2 = P − (High−Low)
S2= 3 - (4- 2 )
S2 = 1
R1=(P×2)−Low
R1= ( 3 x 2) -2
R1 = 4
R2=P+(High−Low)
R2 = 3 + ( 4 - 2}
R2 = 5
Look at the beauty of these calculations
R2 = 5
R1= 4
P = 3
S1= 2
S2= 1
But the good thing is that nowadays we need not calculate these points, they are inbuilt in trading softwares, we just have to apply them.
How to Apply Pivot Point on Chart. (Screenshot with tag your name)
Depending upon the trading software used, you will have to apply pivot points on your chart . For this task i choose tradingview . So I will demonstrate it with help of tradingview app that I have already installed and logged into.
- Launch trading view app. Select the crypto asset to be explored. Let's say ETH / USDT. The chart will load.
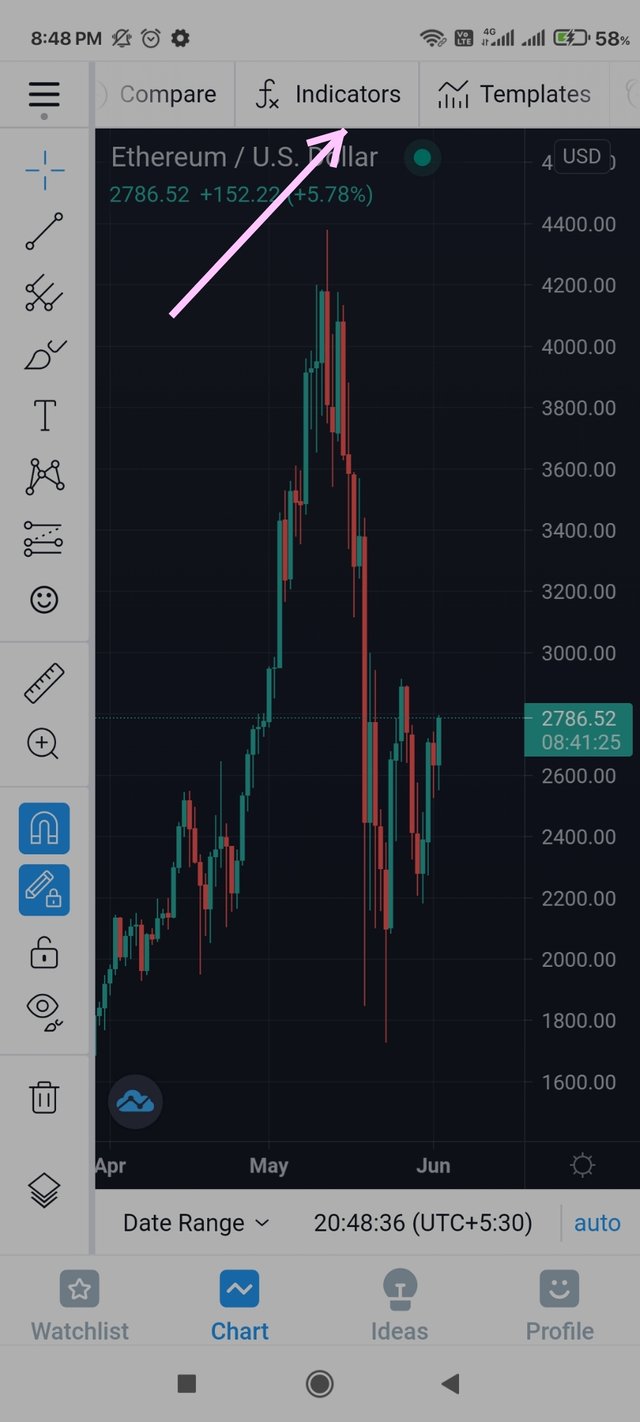
- Next click on fx (indicators and strategies ) at the top as shown by arrow . The following page will load.
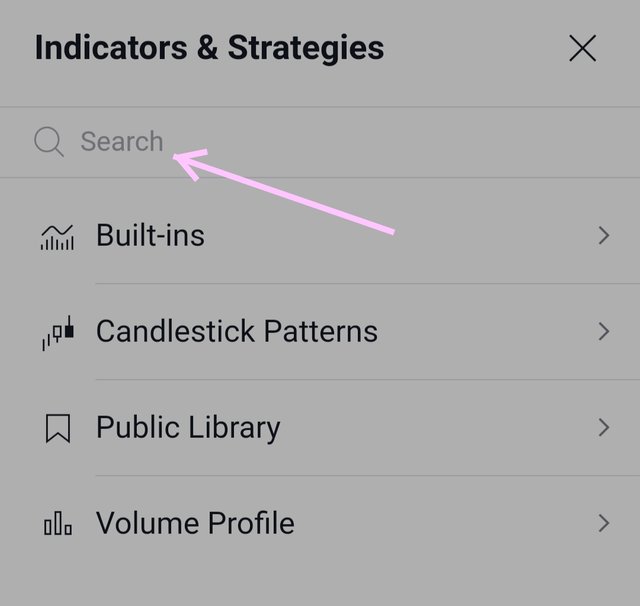
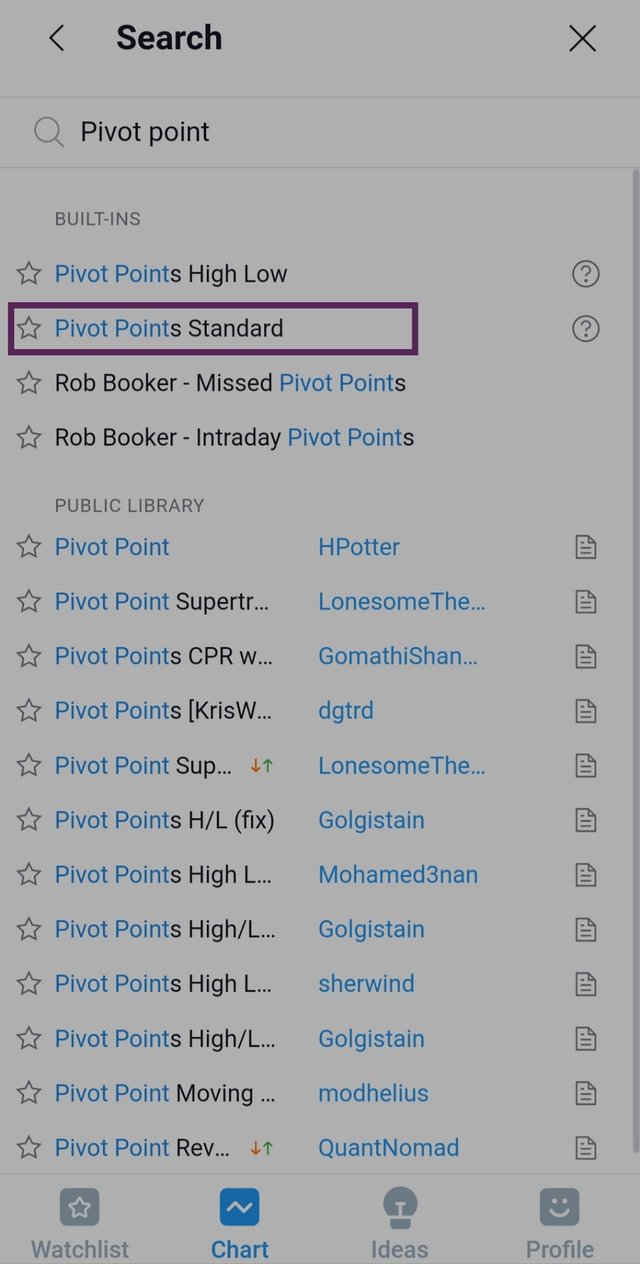
- Search for pivot point in the search bar. Than select pivot point standard.
- Go to chart and you can see pivot points applied.
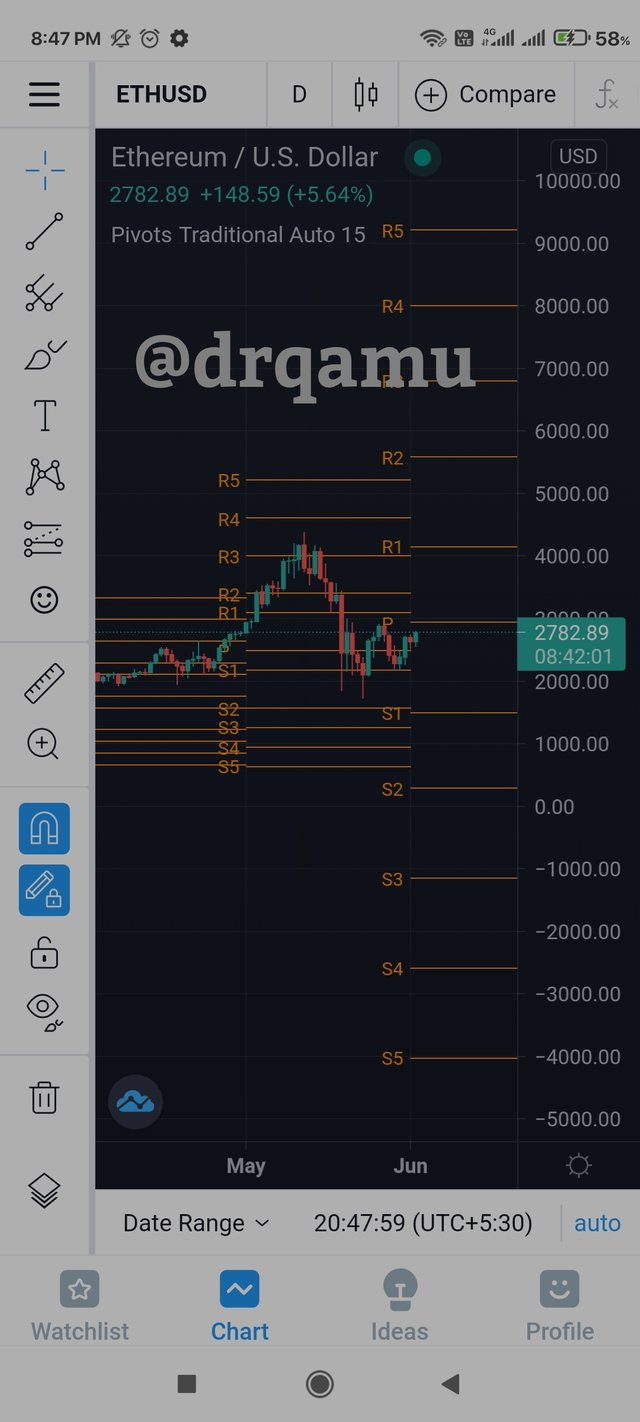
How Pivot Points Work. (Screenshot with tag your name)
Before looking at working of the pivot points, we should have basic understanding of what points are intended to show . Pivot point along with support and resistance levels are static indicators that help intraday traders to predict the trend of the market. When the price of an asset crosses above the main pivot point (P) , it indicate the Bullish trend of the market and when it crosses below the main pivot point (P) or towards the direction of man pivot point from resistance levels , it indicates the bearish trend of the market and therefore it acts as signal indicator for the traders.
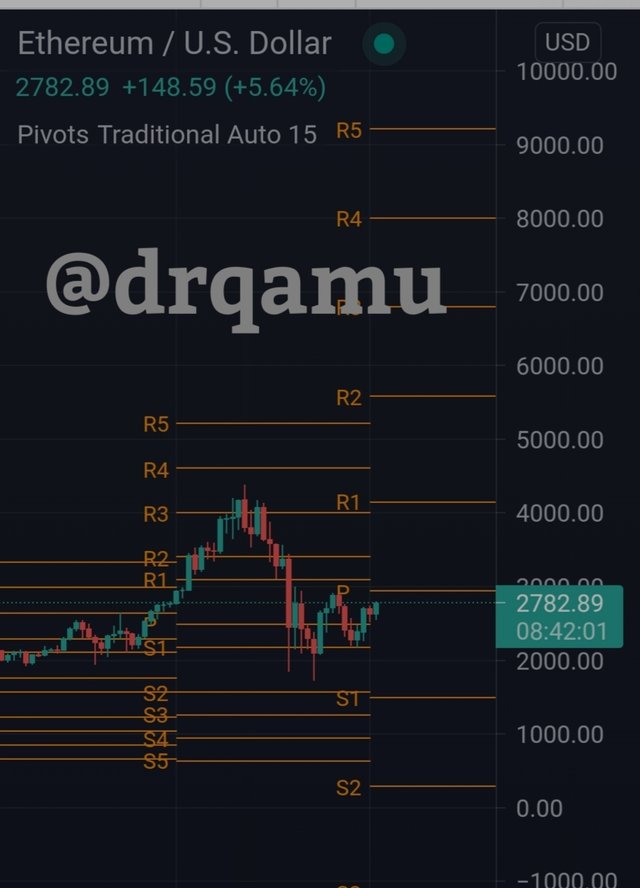
Look at ETH/USDT graph above. At the beginning of above graph, we see that price movement in upward direction crossing S1 and immediately touching the main ppivot point, so it should give a buy signal to trader in the wake of forthcoming bullish trend. If a trader follows pivot point indicator, you can see in the graph above that he would have huge profit because Bullish trend continues till the price touches R3. Then the price correction started taking place. As the price level started coming down towards the main pivot point from resistance level 3, it should give signal to the trader that the asset is going to enter into the beerish trend and therefore act as a sell signal. If the trader short his position just below the resistance leve 3 , you can see in the graph above that the price continues linearly till the price touches main pivot point. So in both uptrend and downtrend, it could have proven beneficial for traders.
Pivot Point Reverse Trading. (Screenshot with tag your name)
Pivot point reverse trading basically show us how an asset price respect the support and resistance and reverse its direction from these levels. Look at chart below
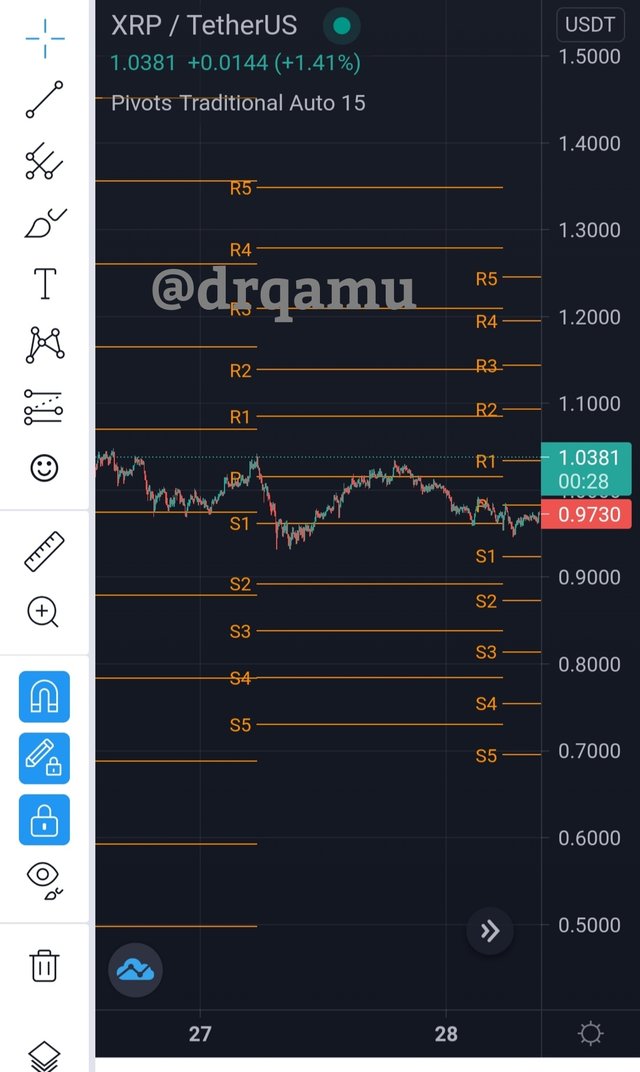
XRP/uSDT chart
XRP price starting below the pivot line towards S1 and so bearish trend is expected. Here a trader can take short position and price dropped till it touches S1 and shortly thereafter it reverses and came back towarde p. Here a trader could have taken buy signal at least till p and than wait for trend to either continue upward or downward and decide on that basis.
What could be a common Mistakes in Trading with Pivot Points
***
Nothing is absolute, it holds true for all the indicators individually and so for pivot points as well. The common mistakes while trading with pivot points are mentioned below:
Entering the market and then not following it closely. As you know that , pivot points are used by intraday traders therefore a close watch of the price is mandatory.
Getting stuck to single time frame. No doubt Intraday traders need small time frames but to look for trend, higher time frames and doing trade on small timeframes is ideal what they should do.
Entering trade without having proper knowledge of the supply, demand, consistent and working strategy in mind etc.
What could be the reasons For Pivot Points is Good.(Pros/Advantages)
it is very simple to use. It can prove beneficial for traders with minimum basic knowledge of the market.
it is easy to interpret with basic understanding of support and resistance.
it has accuracy equivalent to most of the other trading indicators.
When used along with other indicators, it is a trustworthy tool in hands of Intraday traders.
Apply the Pivot Points indicator in the Today chart (the day when you making this task) and set the chart for 15 minutes. Explain the market trend till the time of writing the task and how it will be next till the end of the day. You can give possibilities on both the side bearish and bullish.
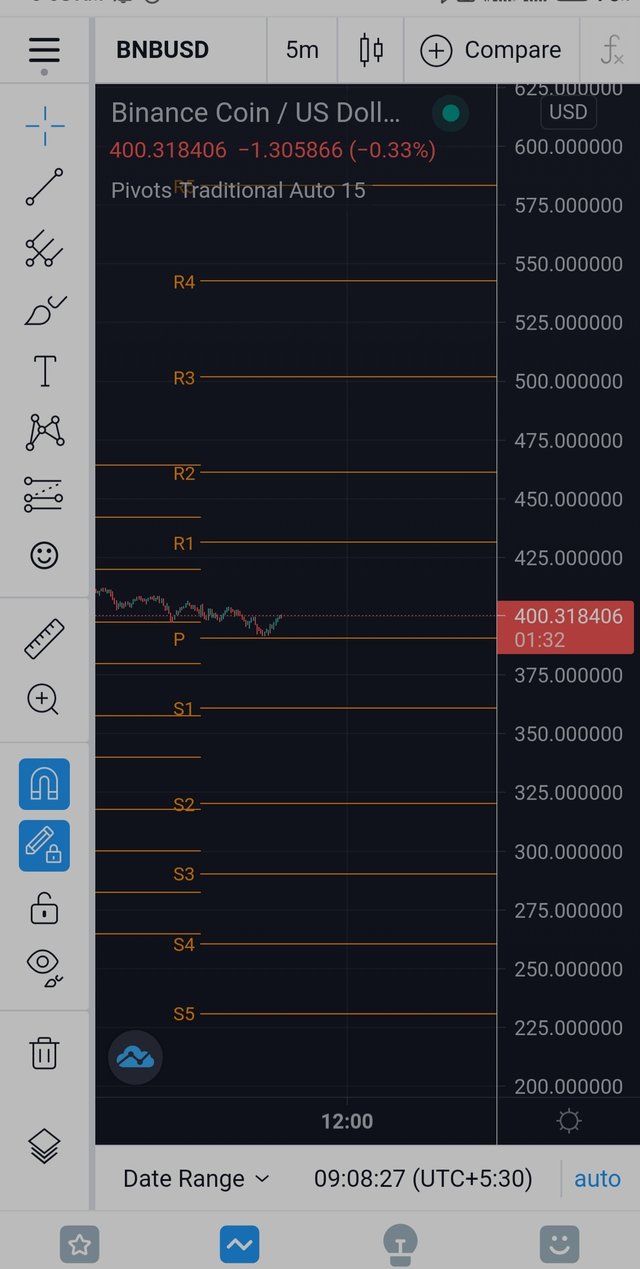
BNB/USDT chart today - pivot applied
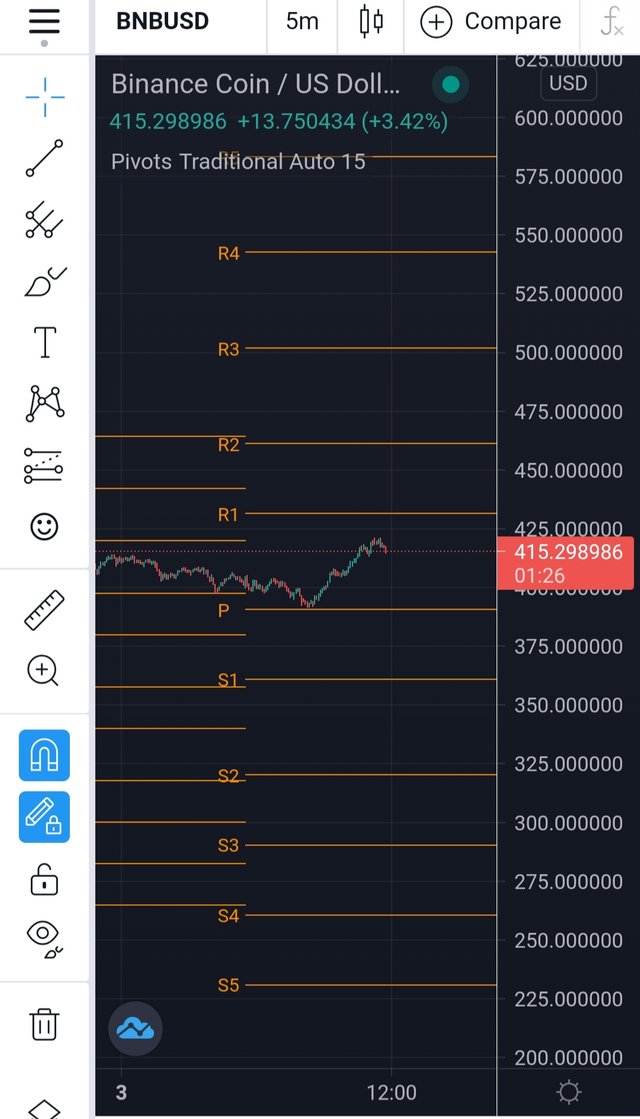
BNB/USDT with pivot points at the time of analysis
Look at the chart above, we started when the price of BNB coin was going up just above the main pivot point. As an intraday trader following pivot points, we should expect the trend to continue towards R1 and does that happen. Look at the second screenshot above which we took at the time of analysis. You can see that, yes exactly the trend continues and has reached just resistance level 1 with slight fluctuation in between.
Looking at previous few days price chart BNB broke certain resistance levels and now before touching R1, price level has begin turning downwards and i expect downtrend to continue till it tests p or S1 for rest of the day.
Weekly Price Forcast Forcost of Etherium.
Etherium is a decentralized open source blockchain and Ether (ETH) is its native token. As for coingecko, ETH stands at Rank 2 in the market with
Market Cap
329,787,119,613
24 Hour Trading Vol
38,580,692,820
24h Low / 24h High
2,639 / 2,843
Circulating Supply
116,136,187 /
So we can understand the strength and trust of traders on Enterium. The dedication and diligence can further be emphasised by its plan to upgrade it to Etherium 2.0 and also its support for diverse smart contracts and dapps etc.
For price predictions, let's look at history of ETH. Look at one month chart of ETH.
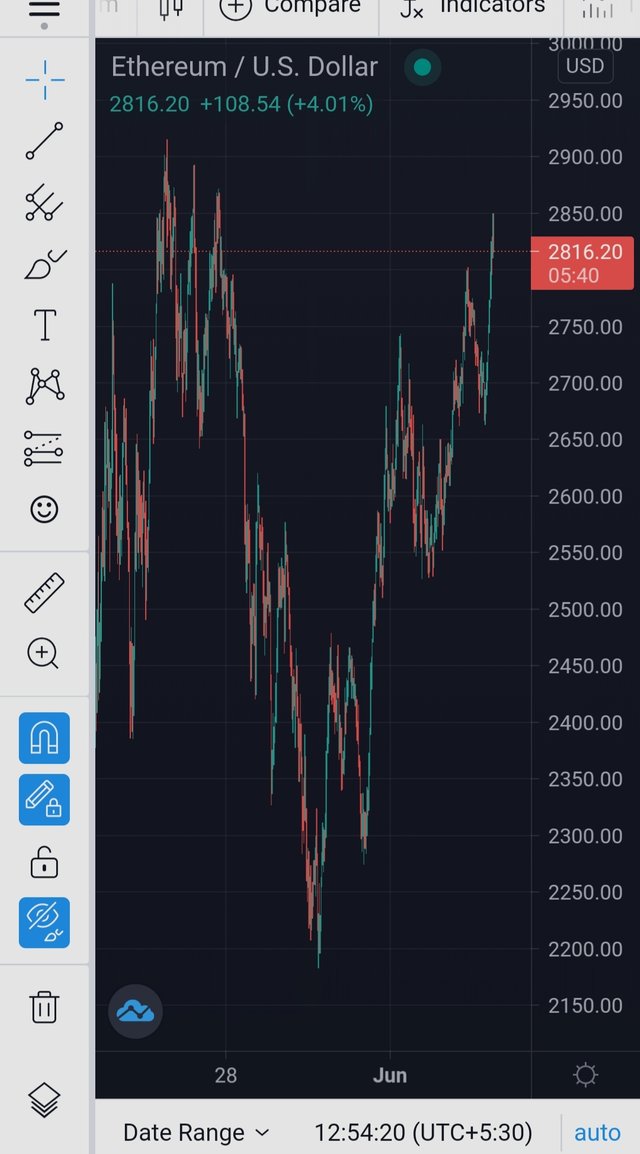
You can see clear bullish trend with breaking of certain levels of resistance when moving further back. Now let's look at one day chart.
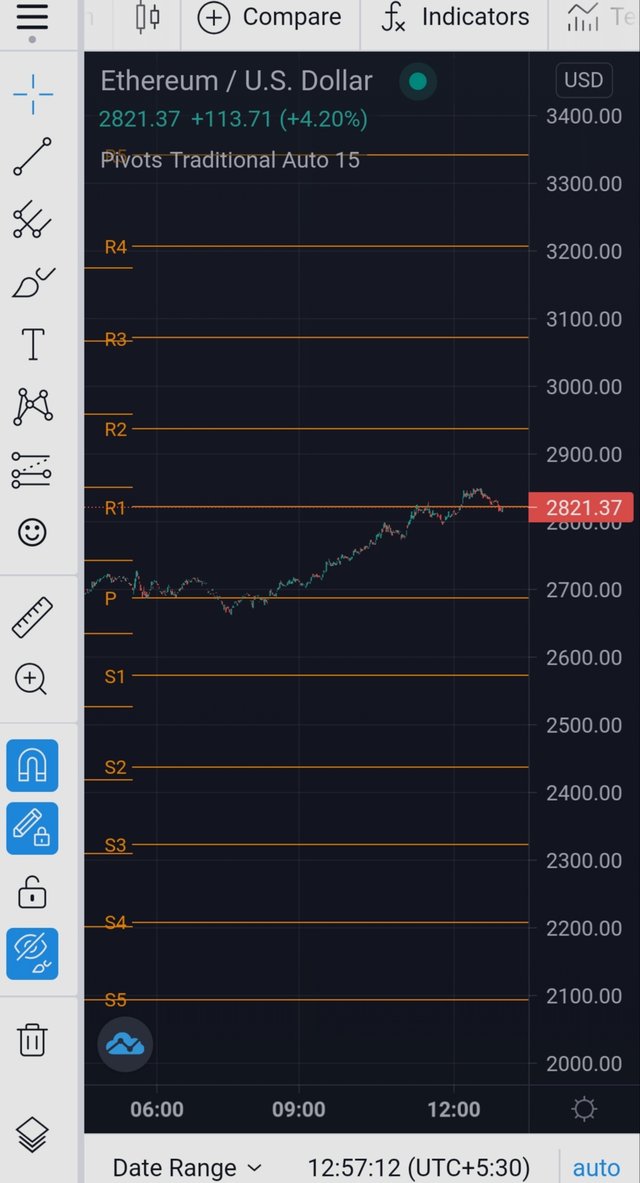
It also shows bullish trend. To begin from p (2700 USDT) and now touching R1 (2821 USDT) , i expect it to continue its bullish trend and go towards 3000$ mark, which you shall see later.
***
Conclusion.
Pivot points unlike oscillators or moving averages is a static indicator that along with its different support and resistance levels is a good trading tool for intraday traders. When it is applied along with other trading indicators and market knowledge, it can be a reliable indicator .


Hi @drqamu
Thank you for joining The Steemit Crypto Academy Courses and participated in the Homework Task.
Your Homework Task verification has been done by @Stream4u, hope you have enjoyed and learned something new.
Thank You.
@stream4u
Crypto Professors : Steemit Crypto Academy
#affable