Crypto Academy / Season 3 / Week 8 - Homework Post for [@asaj]: Crypto Assets and the Random Index (KDJ) by @dilchamo
ENTIRE QUESTION
1.In your own words define the random index and explain how it is calculated
2.Is the random index reliable? Explain
3.How is the random index added to a chart and what are the recommended parameters? (Screenshot required)
4.Differences between KDJ, ADX, and ATR
5.Use the signals of the random index to buy and sell any two cryptocurrencies. (Screenshot required)
What is RANDOM INDEX
The Random Index which is also known as KDJ Indicator is a technical indicator which is used to predict the market price changes over a certain time period. It is considered as a very practical technical indicator. In the Random index there are three lines as K line, D line and J line. the movement of K and D lines are similar to stochastic oscillator. The J line which is new which depicts the divergence of D value from K value. The movement of K line and D line determines movement of selling and buying. All these three lines set up independent curves and predict the golden price trend. The random Index helps determine the trend and optimal entry points.
How to calculate RANDOM INDEX
The calculation of the KDJ indicator is based on the lowest prices, highest prices, and closing prices within a specific time period. There are two horizontal lines marked in the price chart from 20 and 80 which depicts a price reversal when the price moves above and below. The indicator lies between 0- 100 in the price chart. When the price moves above 80 it is an overbought position and if the price moves below 20 it is an oversold position.
CALCULATION
First obtain the Highest, lowest, and closing prices of a certain period and consider the price as n. So imagine the prices are as follows.
- Hn= Highest price of a certain day
- Ln= Lowest price of a certain day
- Cn= Closing price of a certain day
Then we need to obtain the relevant day’s Reserve value (RSV) of the asset.
- RSV of the day= (Cn-Ln)/ (Hn-Ln) X 100
The RSV value is always between 1- 100.
Next we have to calculate the K and D values by using the below formula.
- K value of the day= 2/3 X previous day K value+ 1/3 X RSV of the day
- D value of the day=2/3 X previous day D value+ 1/ 3 X K value of the day
If there is no previous day K and D values to be found. Users can use 50.
- J value= 3 X day K value- 2 X da D value
The KDJ indicator can be used for short-term and medium-term price determinations starting from the week level.
Is the random index reliable? Explain
The KDJ is a trend analysis technical indicator. As we discussed in earlier lessons I think there is no indicator or strategy which is 100% perfect and reliable. But to make it reliable users can combine moving averages, ATR, or ADX with the KDJ indicator and determine the price trend. KDJ may also produce false signals. So my advice for investors is before stepping onto investing better use a few more indicators and strategies to verify the real price trends.
How is the random index added to a chart and what are the recommended parameters? (Screenshot required)
To add the indicator to the price chart first log into Tradingview.com and click on “Charts”.
Then it will be directed to the price charts window. The price chart of the selected cryptocurrency pair will appear in the window. I have selected the BTCUSDT cryptocurrency pair to demonstrate the indicator behavior.
Then click on the “Indicators” icon which is above the price chart. Then a search option box will pop up on the window. In the search bar we can type the name “KDJ”. Then it shows a list of indicators of KDJ but we have to select KDJ By “ll21LAMBOS21” from the library of indicators as it is more reliable and has a high ranking.
Finally, after applying the indicator the three indicator lines can be clearly seen.
In the below screenshot I have taken the price change of 5 minutes. Then In the KDJ indicator has shown some indications.
Overbought signal
- When the J line moves above 80 in the price chart it is known as an overbought situation. In that case the indicator shows that there is a price reversal coming immediately after this overbought position. The investors and traders are getting ready to sell the assets that they have. This is the signal that is given to investors and traders by these indicator lines.
Oversold signal
- When the J line moves below 20 it is known as an oversold signal. The indicator depicts that there will be a price reversal in the asset market. The investors and traders tend to buy assets for low prices here which give them a good profit.
Downtrend Signal
- As seen in the above screenshot, after the first line intersection point there is an immediate downtrend in the market. After a certain trend if there is an intersection point of the lines occur that means there will be a definite price reversal. So it is clear that after the first intersection point the price trends downward till it shows and oversold signal. Investors are not buying assets in the downtrend position.
Uptrend signal
- As seen in the image above, the second intersection point shows a price reversal to upward. The previous price trend will change once the intersection point is met. As the price was in a downtrend before, now the intersection point tells you about an uptrend where investors will buy assets as the price has passed an oversold position.
Dead Fork Signal
- In the screenshot above you can see that the intersection point is above the line 80. This position is referred to as a Dead Fork. The indicator K crosses the D line from top to bottom giving a sell signal.
Golden Fork Signal
- The indicator gives a buy signal when the blue line crosses the D line from bottom to top. This is strong as it happens below line 20. The situation issues a buyer signal to the traders and investors.
Differences between KDJ, ADX, and ATR
KDJ
- KDJ indicator determines if the asset is overbought or oversold by evaluating its price trend. When the K value of the indicator is greater or near 80 then it gives an overbought signal. When the K value is less than or near 20 then it is given as an oversold signal. To get the accurate buying or selling decision investors should compare with other technical indicators as well.
ADX

- Average Directional Index is used to plot the trend strength of an asset. It is calculated by using the price range expansion over certain time period. It is a single line which ranges between 0-100. This helps traders to determine the strongest price trends to trade. There are values to measure the trend strength.
ATR
- The Average True Range Indicator is used to determine the market volatility of an asset in a certain period of time. This is calculated by considering the gaps between price movements. The volatility is depicted by a single line.
Key Differences between KDJ, ADX and ATR
Use the signals of the random index to buy and sell any two cryptocurrencies. (Screenshot required)
I’m going to demonstrate the buy and sell orders using Binance Trading.
Sell Order
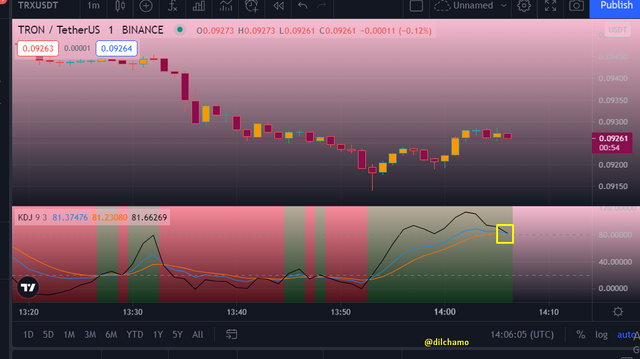
- I have selected the TRX/USDT cryptocurrency pair or trading. The KDJ indicator showed me a sell signal by intersecting the lines and the yellow line moves from top to bottom.
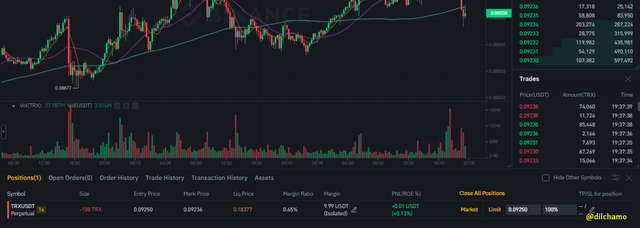
- To perform the sell order I have selected TRX/USDT cryptocurrency pair. My entry price is 0.09252 and the mark price is 0.09236. I have gained a profit of 0.01 USDT from this order. This sell order is profitable for me.
Buy Order
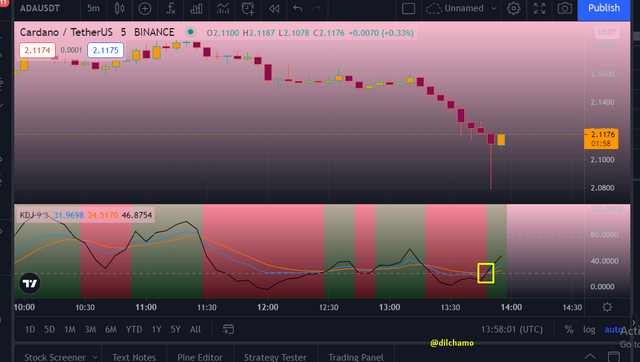
- To perform the buy order I have selected the ADA/USDT cryptocurrency pair. As you can see in the screenshot I go the buy signal at the point of 2.0800.
- Then I placed the buy order. My entry price is 2.11650 and the Mark price is 2.12197. Here also I got a profit of 0.03 USDT.
From both my sell and buy orders I got a simple profit.
CONCLUSION
The KDJ technical indicator is used to analyze the price trend of as asset within a period of time. The golden fork and dead fork determines the buy and sell signals for the investors. This indicator is also known as Random Index. Any indicator is not 100% reliable for investors. So it is good to compare the KDJ indicator results with other indicators such as ADX and ATR before stepping to investing. Thank you Professor @asaj for teaching this valuable lesson. Thank you for reading my post. Have a good day.
.png)


Superb performance @dilchamo!
Thanks for performing the above task in the eighth week of Steemit Crypto Academy Season 3. The time and effort put into this work is appreciated. Hence, you have scored 10 out of 10. Here are the details:
Remarks
I had a good time reading your work. Your explanation of the KDJ indicator was clear and precise. You also displayed a good understanding of the average directional index and avaerage true range. Although your answer to the second part of the third task wasn’t what we were expecting, it reflected that you have done some research on KDJ signals. Keep it up!
Thank you so much Professor @asaj. Your comments means a lot to me.
Хорошая работа!
Thank you so much
Hello, @dilchamo
You have done a great job. 🎖
Thank you.
Good job miss
Thank you