Having read through the presentation by
@stream4u on how to Read Candlestick Charts In Different Time Frame & Information about Buy-Sell (Support & Resistance), I'm delighted to participate by contributing my quota to the homework given to us
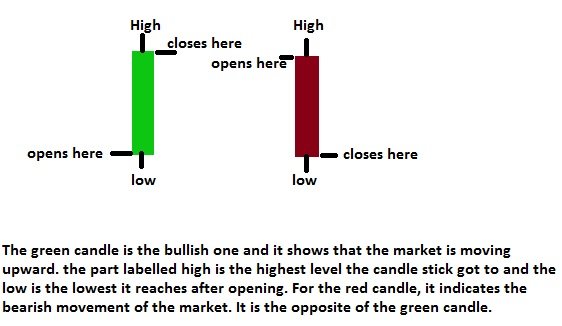
The green and the red candle are indications that show the movement of the market. It might be up or down movement. Specifically, The green candlestick shows the bullish movement, while the red one displays the bearish movement of assets. Whenever the candle turns green, it is an indication that the market is going up which signifies buy. When traders buy, the green candle comes up, but when the market is more of selling, the red candlestick starts building and we see the red spike
I learned a lot from the post from
@stream4u and it gave me more understanding in my research. Reading candlestick might seems easy, but in some cases, it's not. However, there are some things that help traders to determine whether to enter the market at a particular time or wait for a clear time just as our professor explained to us and gave us more insight
One of them is the support and resistance level, but I won't talk about them now because there are questions on them that would be answered as I write further. First, I understand that we must know the basic things about the candlestick itself like the high, close, open, and low in the case of the bearish (green candle), and the high, close, open, and low in the case of a bearish (red candle)
Below are examples of bullish and bearish candlestick I designed.
This is also a screenshot showing the bullish and bearish candles of an asset.
Going further, there are also some ways to read thecandle sticks to know whether it would go up or come down apart from the resistance and support. To me, I trust the resistance and the support lines but these readings are also on point for whosoever understands them well. I will list two
1. Bullish engulfing candle: When a small red candle is overshadowed by a larger one, there is a potential upward movement of the asset because it signifies that the buyers are pushing further. This kind of reaction in the market culminates a slightly positive reaction that the buyers might have an upper hand for a particular period of time
From the above image, the green candle engulfs the red and there was an immediate spike, though it didn't last before the bears highjacked and turned the market back. In this case, a sharp day trader that is watchful would take profit before the reversal
2. Doji sign: A doji is always seen as a plus sign and it can be red or green. If there is a green doji, it's like the bulls are stronger at that moment and vise versa. Reading the candlestick is in numerous ways. The thing is that it's not always certain. However, a good, patient, and conservative trader would use all these to his/her advantage.
The candle chart has different time frame. They are 1 minute, 5 minutes, 15 minutes, 1 hour 24 hours, weekly, and so on. They are used depending on the kind of trader trading an asset. for instance, I'm more of a short-term trader. And as such, I mostly use the 15 minutes time frame. For long-term traders like swing traders, they are likely to go for a weekly or monthly time frame. So the kind of trader determines which time frame is appropriate to use. Whenever I use 15 minutes time frame, I watch the market almost all the time, and once there is a spike and I've made some profit, I quickly exit the market before the bears take charge
.png) This is an image of a candle chart time frame
This is an image of a candle chart time frame.
And why we need to change the time frame. Yes according to my understanding of why we need to change the time frame, it is because when we check the time frame of what has happened in the market in the past hours, It would help to understand how the market has been moving, and give an insight on whether the bulls are taking it or the bear. For instance, if I analyse the market by checking the 1 hour , 4 hours, and 12 hours time frame, I would be able to know when to enter the market because the chart would show me how the assets has been doing before the present time I want to place a trade. If there are more red candles, that is a clue that the market is on the downside, and vice-versa
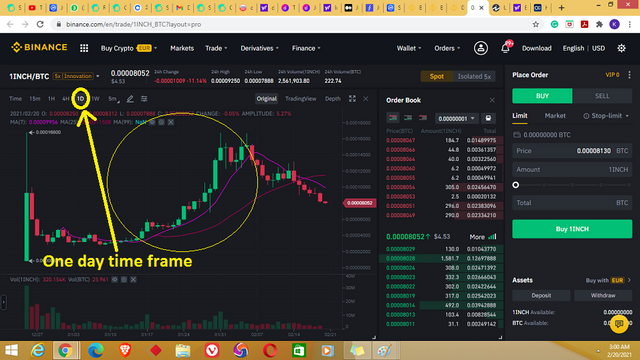
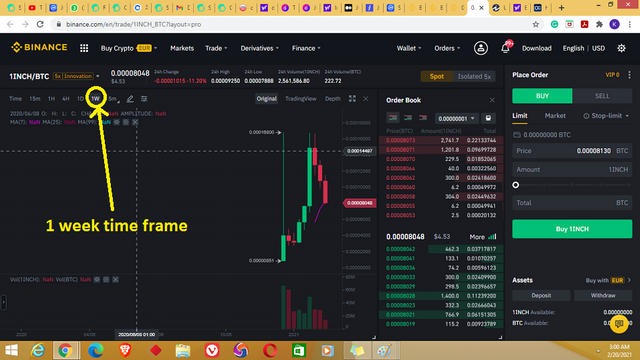
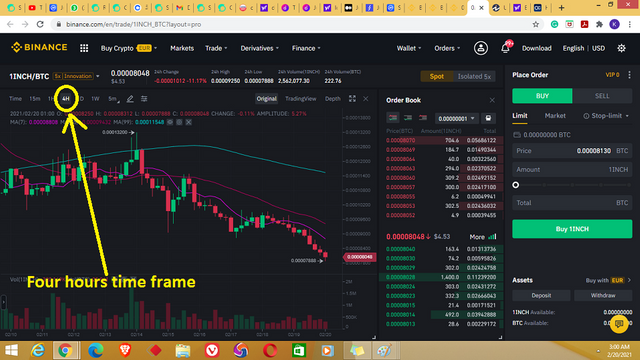
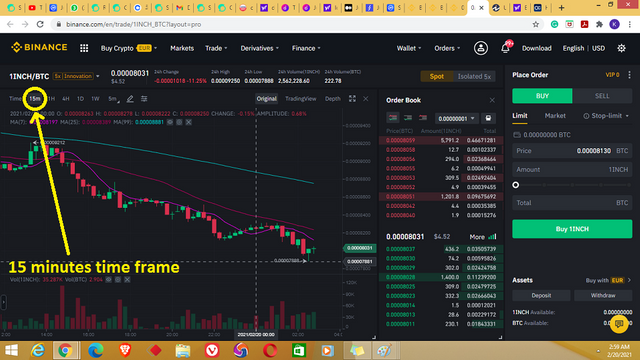
What I noticed in the different time frame chart is that the lesser the time, the plenty the candlesticks. Looking at the 15 minutes chart, a new candle builds after every 15 minutes, which gives room for plenty of candles to build. But in the case of the one-week chart, the candlesticks in the chart are few, because it only shows what happens in the week and not what happens in minutes. Also, I can see that the resistance and support level of 1 week and 1-day chart, stays inline because the bullish candle has a very long body which indicates a stronger pressure, which is not always easy for the small ones to withstand. Every other candle that was built as the market fluctuate didn't pass both levels. The market move in between the lines throughout the time frame. Just as the professor explained, this level is when traders should be patient and enter the market at the right time. The four hours and 15 minutes time frame show more of a bearish market. compared to the other
The type of traders and how they work. There are many types of traders. The type of trader we are would determine our ways or trading pattern. Some of us can be aggressive, conservative, or moderate.
First, let me start by saying I'm more of a short-term or a day trader and I can say I'm conservative because I'm not greedy and I have a disciplined mindset. I seldom leave my trade to linger before I take my profit. The only time I stay longer is when the market is against me and I know that it might come back in my favor. Else, I would classify myself as a short-term trader (90%). So what a day trader does is what I've explained using myself as an example. I set my 15 minutes time frame and watch as the market moves at interval so as to take profit when there is a spike in my favor
There are also the long-term traders that can be classified under swing traders. These sets of traders analyze the market using a long-term time frame and place their trade. They can leave it for weeks, months, and possibly years. They don't care what happens to the asset at the initial stage. Even when they are aware that the market is against their investment, they never panic because their aim is to leave the investment till the time they forecast that the asset would yield more and overwhelming profit. An example is the dogecoin. Any swing trader that invested in Doge 2 or 3 years ago, would hundreds of thousands of turnover by now. That is what most swing traders do
The important of support and resistance cannot be waved in trading. In fact, it is one of the easiest ways that help a trader to know when to buy or sell. Let me explain with a diagram
When the price of an asset goes up and it got to a particular stage where the traders started selling, the power has shifted, and that's how the market will continue to move. But the Highest level the price hit and the lowest level would be the support level (for bullish candle) and the resistance level for the bearish candle. Once the resistance and the support has been created, the market mostly moves in between them. So when the asset comes down to the resistance level, it is advisable to buy, because there is a higher probability of the asset going bullish.
- So the resistance and support level helps traders to know when to enter the market
- It helps to know when to exit the market, especially for day traders like me
- It helps the trader to know how to read and analyze the way the market is moving
How we can find the Support in the candle chart, explain with one of the asset Candle charts with screenshot and point the levels. I would like to show my image before explaining. See it below.
.png)
From the image above, the support level is the highest peak the asset price hit. Also, the resistance level is the lowest price of the asset. So we can find the support by looking for where the highest price point is displayed in the market. (This can be seen in every chart no matter the time frame used). So the place rule at the top with a yellow line is the support line.
After finding the support, we need to be patient and make sure we watch till the candle gets to the resistance level before we place a buy order. Once we know the support level as the peak of the market, and we want to follow a bullish trend, we must be patient and watch till the asset comes down to the resistance level. Then we can buy.
Thank you @stream4u for this wonderful topic. I hope I've tried my best to explain the little I understand about the homework you gave us. Looking forward to participating further.
Thanks
CC
@steemitblog
@steemcurator01
@steemcurator02
All images used are my design and screen short from my device.
.png)
.png)
Thank You For Showing Your Intrest in Steemit Crypto Academy
You have completed the homework task and made a good post, explained very nicely about How To Read Candlestick Charts In Different Time Frame & Information about Buy-Sell(Support & Resistance).
Remark: Homework Task Completed.
Thank You.
@stream4u
Crypto Professors : Steemit Crypto Academy
#india #affable
Thank you a lot my professor. You have enlightened us more on this topic and I'm grateful for the understanding. One love. Thanks
Thank you. Today we are going to release our third publication, I am sure you will like this also.
Sure. I will always participate in your homework. I love your topics. Thanks a lot.