Crypto Academy Season 3 Week 1 (Homework Post for @kouba01) Trading with Ichimoku-kinko-hyo Indicator.
The questions
Homework Task-1 :
1- What is the Ichimoku Kinko Hyo indicator? What are the different lines that make it up? (screenshots required)
2- How to add the Ichimoku indicator to the chart? What are its default settings? And should it be changed or not? (screenshots required)
3- How to use the Tenkan Sen line? How to use the Kijun Sen line? And How to use them simultaneously? (screenshots required)
4- What is the chikou span line? And how to use it? And Why is it often neglected? (screenshots required)
5- What's the best time frame to use Ichimoku? And what is the best indicator to use with it? (screenshots required)
6- Conclusion :
Introduction
Question 1
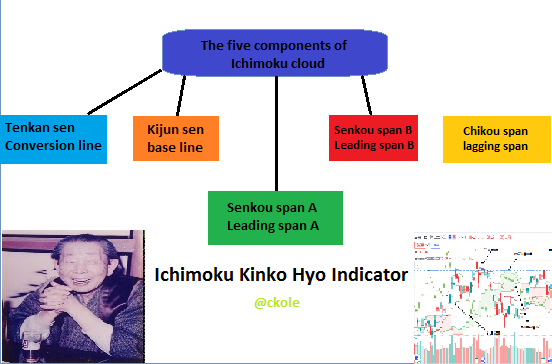
- Senkou Span A
- Senkou Span B
- Tenkan Sen – turning (return) line
- Kijun Sen- baseline
- Chikou Span – Delayed Line
These two conjunctions produce the cloud in the Ichimoku graph.
200.png)
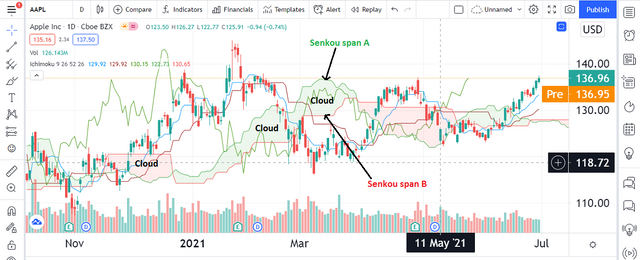
The senkou span A, B and the cloud.
Question 2
Adding the Ichimoku-kinko-hyo Indicator to a chart depends on the tools/exchange you are using to trade. I will show how to add it to the chart using Binance and tradeview.com.
- Log into your Binance account and click on market.
.png)
Image showing where to click market
2 After clicking on any pair of your choice, you will be directed to the chart. as seen below.
.png)
3 Click the icon shown in the above image and search for Ichimoku. Make sure you don't write Ichimoku-kinko-hyo because it won't display anything like that. When you write only Ichimoko, it would show Ichimoku cloud in the search option.
.png)
4 Click on the Ichimoku cloud displayed. The indicators will reflect on the graph as shown below.
.png)
Adding Ichimoku-kinko-hyo on tradingview.com
- Go to tradingview.com and signup if you don't have an account with them.
2 After having an account with them, click on the chart on the home page as displayed below.
.png)
.png)
3 Select any market of your choice
.png)
4 Then click on indicators & strategies (fx)
.png)
5 Then click on Ichimoku cloud as shown in the image below
.png)
200000.png)
The default settings of Ichimoku-kinko-hyo indicator
According to the analysis by the Japanese founder of Ichimoku cloud indicator, he made it clear that the (9, 26, 52) settings, which is the default settings is the best and it generates the best result. However, it can be adjusted to suit the purpose a trader wants to achieve depending on the type of trade he wants to embark on. It was noted that the 9 stands for a week and a half including Saturday, so it is calculated from Monday to Saturday, which is 6 days plus 3 days = 9. The 26 days represent a month, and obviously, 4 Sundays is out of it so (30 - 4 = 26). The 52 days is said to be two months, which is calculated as 52 days with 8 Sundays out. (60 - 8= 52)
.png)
While the default settings is regarded as the best approach to using the Ichimoku indicator, some traders change the settings to suit their trading style. Is it okay or not?
Well, in my opinion, and according to what I learned, it is not a bad practice to change or adjust the settings because many traders adjust the settings to fit different strategies while trading. Once a trader understands the tool and how to use it effectively, he can change the parameters to his desired figure provided he has the knowledge and understands the in and out of the indicator. Below is a slight change in the figure to (20,60,120,30).
.png)
I changed the settings of my Ichimoku indicators. From the image below, you can see the colors I gave the lines.
.png)
Tekan sen (Conversion line) - Yellow
Kijun sen (Baseline) - Brownish red
Chikou span (Lagging span) - Green
Senkou span A (leading span A) - Purple
Senkou span B (leading span B) - Ash
These are the colors I would use for the rest of my analysis.
Question 3
.png)
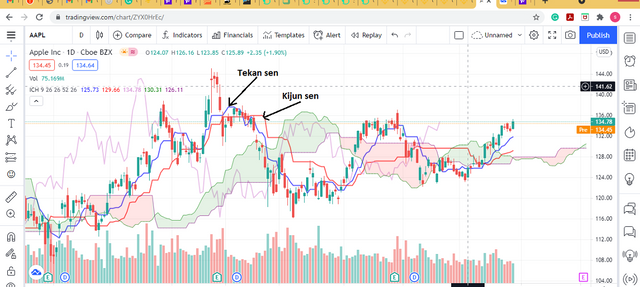
The tekan sen is the key indicator for short time price movement. when we take the highest high for the last 9 period and add it to the lowest low of the last 9 period, and divide by two, it shows the average volatility within the indicators
let's see the image below
.png)
The Tekan sen line moves along with the price of the asset by following it closely and it helps to determine a short-term price momentum, thereby showing the direction of the price of the asset whether it's going bullish or bearish. It also shows a likely point where short support and resistance could occur within a limited time frame. The Tekan sen line is mostly not all that effective on its own. It is more effective when used with other indicators, however, it can be used for a short period calculation. When the conversion line move above the baseline, a bullish is expected to take place.
The Kijun sen acts almost the same way as Tekan sen in the sense that they are calculated using the highest high plus the lowest low, then divided by 2 (I.e, Higher + lower /2). The difference between them is that they are calculated based on 9 and 26 periods. While the Taken sen line deals with a short-term price indication, the kijun sen line shows a long-term trend. When the Kijun sen line stays above the price of an asset over a period of time, there is the probability of the market going bullish and at the same time when the line moves and remains below the price of an asset, the downward trend might continue. This is the way momentum plays its role in the case of the identical lines(Taken sen and Kijun sen).
From the image above, the Kijun sen also paly the role of support looking at the flat areas in the graph.
.png)
The image below shows some marked points
The best way to see the effectiveness of these indicators is to use them together. From my close look at both lines, I can say that they complement each other. When the two lines cross each other two things are expected to happen on the graph. It's either we see a bullish or a bearish movement of the asset. Let's see the image below and analyze the point mentioned.
.png)
I spotted 6 points on the graph, and all those points play a significant role in the trend of the asset. We have bullish and bearish patterns and it's as a result of the collision between the Tekan sen and the Kijun sen lines. Whenever the line crosses each other, there is always a swift reaction, either way (up or down). Whenever the lines cross each other, it is referred to as TK CROSS. I also deduced from the chart that the bullish and bearish pattern that occurs when the lines cross is determined by the candlestick that builds. If a bearish candlestick builds up consecutively after the TK CROSS, the market is likely to go downtrend and vise versa. Also, there's virtually an equilibrium position before every upward movement on or before the TK CROSS.
Question 4
4 What is the chikou span line? And how to use it? And Why is it often neglected? (screenshots required)
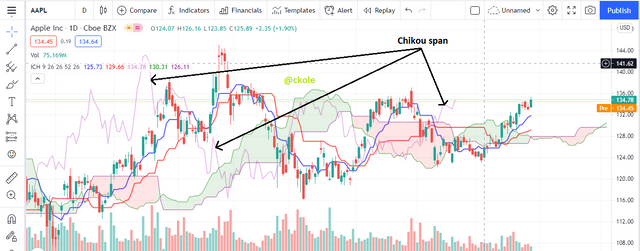
The Chokou span is also a good indicator among the Ichimoku cloud indicators. It represents a 26 period lagging behind, which is the closing price 26 periods backward. This indicator can reflect buy and sell signals and it can also help to spot future trend reversal. Let's see the image below and do a little analysis.
.png)
If the Chikou line is to be used to enter a trade like this, it plays a good role here because when the line eventually entered the cloud on its way down, it is an indication that the market will keep going down for a particular period, so in this case, a trader can get an entry point and place a sell order in the case of forex trading. Also, when the line enters the cloud on its way up, chances are that the trend will continue upward, so a trader can also at this point enter the trade as it goes bullish. Most times, the Chikou indicator takes an eternity to spot, but if a trader can be patient to spot the point, it would be an additional indicator to spot the trend and reversal of an asset.
I think the chikou span line is a little boring to watch because in most cases, it doesn't give the exact green light needed by a trader to jump into the market, maybe because of its lagging nature (26 days into the past).
Also, it was specified that when the line move above the asset, or below, it's either there is a bullish or bearish trend. But in most cases, the market reacts in a way that contradicts the line movement, so this makes traders neglect the chikou line in such cases.
The Chikou span line is more useful if combined with other indicators. Using it on its own is boring, and would likely give no reasonable indication of a bullish or bearish trend. So the reason it's mostly neglected is that it can't reflect what traders want on its own in most cases except used with other indicators.
Question 5
Every indicator I've known can be used with a different time frame. Using a particular time frame depends on how the trader understands his or her analysis. In trading, we have different types of traders.
We have the scalpers, day traders who trade with respect to the trend by using various technical analyses to spot the entry and exit point focusing on immediate trend. They are used to daily trading, and if such trader wants to use the Ichimoku indicator, they would probably set it to the preference that would tally with their trading style.
The same goes with a swing trader and position trader. Time frame can always be adjusted.
A swing trader might decide to set a time frame of 2 months or more. And that doesn't mean he won't achieve his goal if properly analyzed if there's enough capital to combat liquidity. A position trader can also set his time as he wishes. Talking about the use of Ichimoku indicators or others, any suitable time frame can be used. It all depends on the trader and his style of trading.
.png)
From the study I've acquired studying the Ichimoku cloud indicator, I think I can best use the Stochastic RSI with it. I discovered that using the stochastic RSI with the Taken sen and Kijun sen line would give me the pure signal of when a bullish and bearish trend would occur. In my TK CROSS analysis, I was only able to know whether the TK CROSS was going to be bullish or bearish with the type of candle stick-built consecutively after the cross. This might fail me sometimes if I'm not patient enough or not fortunate. With the stochastic RSI, I would be double sure of the trend of the asset when used with the Ichimoku indicator. Let's check this image
.png)
From the image, I marked some points and drew some arrows to indicate some points too. The stochastic RSI is measi=ured from 0 - 100. When the Stoch RSI line goes below or at 20, there is a great probability of the asset going upward because, at that point, the asset has reached the level called the oversold point, and here, there is likely to be a reversal. Also, this point where the Stoch RSI line hits 20.09 (Written in yellow) is where the tekan and kijun lines cross. The use of these double indicators gives me a pure bullish signal because
The crossing of tekan sen and kijun sen breeds either bullish or bearish trend
As I noticed that the Stoch RSI is at 20.09, and at the same time seeing tekan sen and kijun sen line crossing, I get the clue that the market will go up because it is at an oversold level.
Using the Stoch RSI and the Ichimoku indicator together can be of great help. I prefer it well.
Conclusion
The Japanese (Hosada Goichi) that discovered this indicator did marvelous research. The Ichimoku kinko hyo is a great 5 in one indicator that can be used in many ways while trading. The other Ichimoku indicator that isn't counted, which is the cloud can be used to spot momentum and identify market trends, and the senkou span A can be used to spot the support and resistance level on a graph.
At first, it seems the Ichimoku graph is complex, but it turned out to be easy in the end. Understanding other indicators would give a trader quick knowledge while studying the Ichimoku indicator, and to get a high level of accuracy, using the Ichimoku indicator with other indicators would be good because all indicators complement each other. The point line of using indicators is to get the right signal. Ichimoku indicator is a very good technical analysis tool that can help a trading journey because it can also be used independently if need be.
Thanks to @kouba01 for this wonderful lecture on Ichimoku Indicator. Best regards.
Thanks for reading.
Cc: @kouba01
Hi ckole
Please support
If you want to know trending news on bitcoin or all cryptocurrency news then follow my account . I am uploading daily cryptocurrency news so please follow my account friends k
@ckole, Please use the correct hashtag kouba-s3week1.
Sorry prof. It was a spacing error. Done
Hello @ckole,
Thank you for participating in the 1st Week Crypto Course in its third season and for your efforts to complete the suggested tasks, you deserve a 10/10 rating, according to the following scale:
My review :
You really did a great and integrated job as promised since the first days of publishing the lesson, which indicates that you took your time to search for and analyze the information to provide excellent content that covers the topic in all its aspects efficiently, adopting a clear methodology.
Thanks again for your effort, and we look forward to reading your next work.
Sincerely,@kouba01
Thanks a lot, prof. I really took my time to understand the indicator and it helped me big time. I'm really learning. Knowing stuff like this is a plus, and it will help my journey in the world of cryptocurrency. Looking forward to learning more as the academy proceeds. I'm grateful.