Crypto academy week 16 - Homework post for [@stream4u] pivot point
What Is a Pivot Point?
A pivot point is a technical analysis indicator, or calculations, used to determine the overall trend of the market over different time frames. The pivot point itself is simply the average of the intraday high and low, and the closing price from the previous trading day. On the subsequent day, trading above the pivot point is thought to indicate ongoing bullish sentiment, while trading below the pivot point indicates bearish sentiment.
The pivot point is the basis for the indicator, but it also includes other support and resistance levels that are projected based on the pivot point calculation. All these levels help traders see where the price could experience support or resistance. Similarly, if the price moves through these levels it lets the trader know the price is trending in that direction.
A pivot point is an intraday technical indicator used to identify trends and reversals mainly in equities, commodities, and forex markets.
Pivot points are calculated to determine levels in which the sentiment of the market could change from bullish to bearish, and vice-versa.
Day traders calculate pivot points to determine levels of entry, stops, and profit-taking.
How do pivot points work?
A pivot point uses a previous period's high, low, and close price for a specific period to define future support. Then, they apply calculations to determine the points. Additionally, they determine stock market trends over different time periods. Pivot points were originally used by floor traders on stock exchanges.
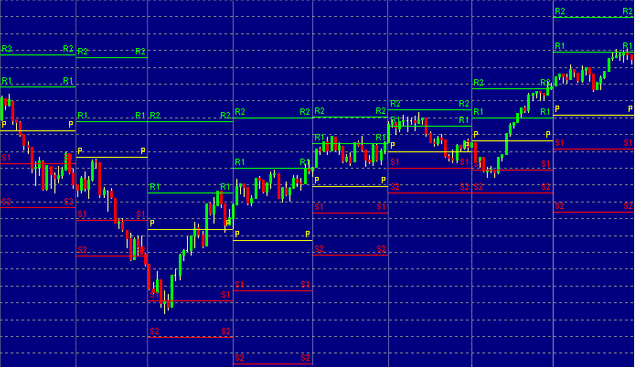
Pivot Points
The Formulas for Pivot Points:
\begin{aligned} &P = \frac{\text{High} + \text{Low} + \text{Close}}{3}\ &R1 = (P \times 2) - \text{Low}\ &R2 = P + (\text{High} - \text{Low})\ &S1 = (P \times 2) - \text{High}\ &S2 = P - (\text{High} - \text{Low})\ &\textbf{where:}\ &P=\text{Pivot point}\ &R1=\text{Resistance 1}\ &R2=\text{Resistance 2}\ &S1=\text{Support 1}\ &S2=\text{Support 2}\ \end{aligned}
P=
3
High+Low+Close
R1=(P×2)−Low
R2=P+(High−Low)
S1=(P×2)−High
S2=P−(High−Low)
where:
P=Pivot point
R1=Resistance 1
R2=Resistance 2
S1=Support 1
S2=Support 2
Note that:
High indicates the highest price from the prior trading day,
Low indicates the lowest price from the prior trading day, and
Close indicates the closing price from the prior trading day.
How to Calculate Pivot Points
The pivot point indicator can be added to a chart, and the levels will automatically be calculated and shown. Here's how to calculate them yourself, keeping in mind that pivot points are predominantly used by day traders and are based on the high, low, and close from the prior trading day.
If it is Wednesday morning, use the high, low, and close from Tuesday to create the pivot point levels for the Wednesday trading day.
After the market closes, or before it opens the next day, find the day's high and low, as well as the close from the most recent previous trading day.
Sum the high, low, and close and then divide by three.
Mark this price on the chart as P.
Once P is known, calculate S1, S2, R1, and R2. The high and low in these calculations are from the prior trading day.
TradingView.
What Do Pivot Points Tell You?
Pivot points are an intraday indicator for trading futures, commodities, and stocks. Unlike moving averages or oscillators, they are static and remain at the same prices throughout the day. This means traders can use the levels to help plan out their trading in advance.
For example, traders know that if the price falls below the pivot point they will likely be shorting early in the session. Conversely, if the price is above the pivot point, they will be buying. S1, S2, R1, and R2 can be used as target price for such trades, as well as stop-loss level.
Limitations of Pivot Points
Pivot points are based on a simple calculation, and while they work for some traders, others may not find them useful. There is no assurance the price will stop at, reverse at, or even reach the levels created on the chart.
Other times the price will move back and forth through a level. As with all indicators, it should only be used as part of a complete trading plan.
FOREX TRADING STRAT
Mark this price on the chart as P.
Once P is known, calculate S1, S2, R1, and R2. The high and low in these calculations are from the prior trading day.
https://www.investopedia.com/thmb/zkfeovDEzn2vCyumFpHA0TFFiKM=/3822x3822/smart/filters:no_upscale()/dotdash_final_Using_Pivot_Points_in_Forex_Trading_Dec_2020-01-c5d22b984343465ab5a722deb8d54446.jpg
To calculate the pivot lines you should then apply the following formulas:
1
Pivot Point (PP) = (Daily High + Daily Low + Close) / 3.
2
R1 = (2 x Pivot Point) – Daily Low.
3
R2 = Pivot Point + (Daily High – Daily Low)
4
R3 = Daily High + 2 x (Pivot Point – Daily Low)
5
S1 = (2 x Pivot Point) – Daily High.

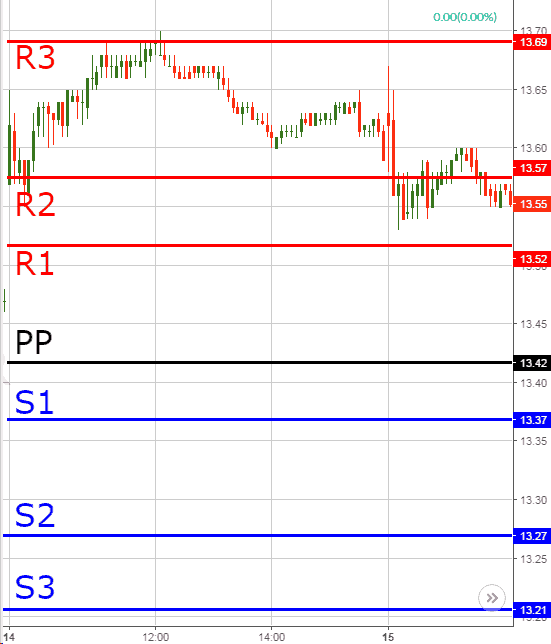
What is R1 R2 R3 and S1 S2 S3?
The three levels of resistance are referred to as R1, R2, and R3 while the three levels of support are referred to as S1, S2, and S3. ... The support and resistance levels are used primarily as trade exits. For example, if the market price breaks above the pivot point, R1 and R2 may be used as trade targets.
What is pivot points strategy?
Pivot points are used by traders in equity and commodity exchanges. They're calculated based on the high, low, and closing prices of previous trading sessions, and they're used to predict support and resistance levels in the current or upcoming session.
CONCLUSION
Do in cryptocurrency trading analysis they are lots of tool that are beneficiary when it comes- to price predictions and capitalization which will enable traders make more profit,
But the knowledge of pivot point are very silent in prediction of current market price therefore the previous highs, lows and close level will go overview of the market trend given the trader a good terms to take decision and predict current market price and analysis on how to trade and make good profit.
Hi @christben
Thank you for joining The Steemit Crypto Academy Courses and participated in the Homework Task.
61% Plagiarism Detected.
Your Homework Task verification has been done by @Stream4u, hope you have enjoyed and learned something new.
Thank You.
@stream4u
Crypto Professors : Steemit Crypto Academy
#affable
Ok professor, thanks.