Crypto Academy Week 5 Homework Post for [stream4u]… by benton3 set at 100% powerup.
Hello fellow steemians, it is time once again to engage in the homework task of our crypto academy. Today I am writing on
All About SuperTrend Indicator.
What Is A SuperTrend Indicator?
A Supertrend indicator is one of the trend indicators used in trading. It can be used by daily traders or by longterm traders. A supertrend indicator is just a line which follows the price. It can be seen either above the price in the case of a sell, or below the price in the case of a buy.
Show how to set SuperTrend on Chart and what are its settings need to configure.(Screenshot Needed)
For the purpose of this lecture, i plead with you as I will be using a forex platform for it. I dont have a crypto platform that have supertrend indicator. Hope you understand with me.
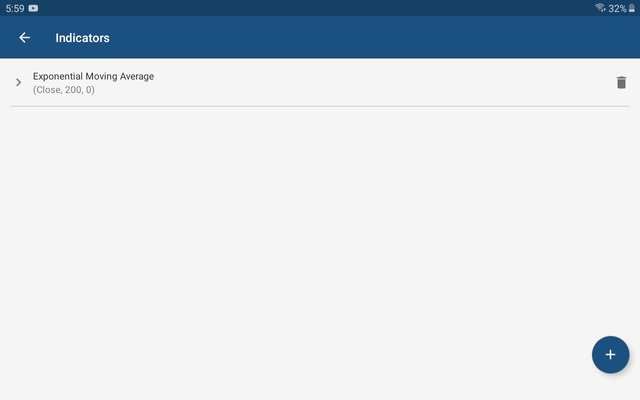
To add a supertrend indicator,
Click on the f symbol, the f symbol is indicators symbol.
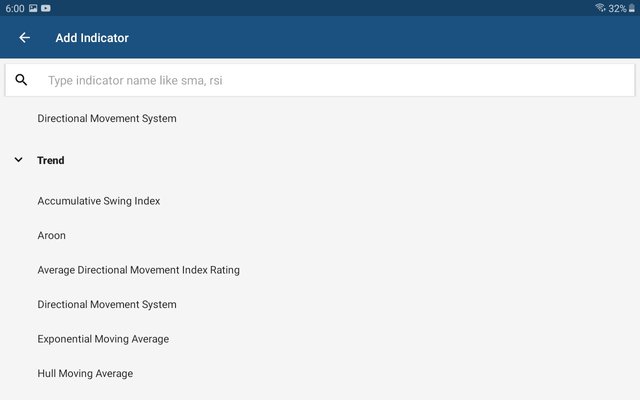
Then click on the plus sign
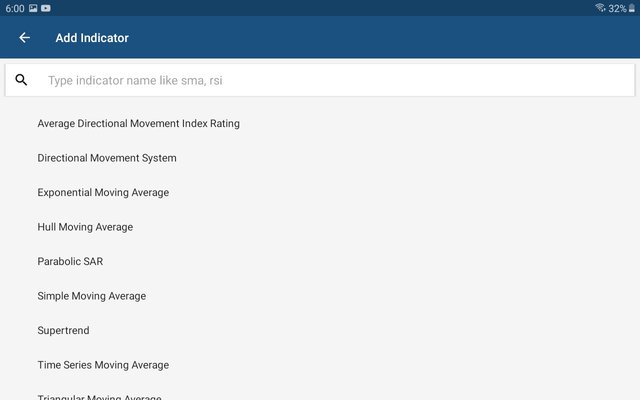
Select trend
Select on supertrend
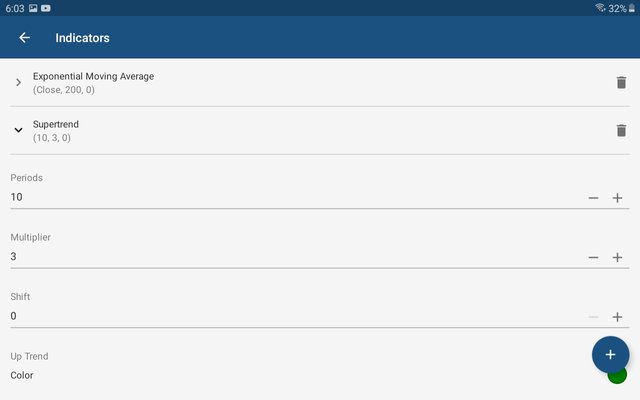
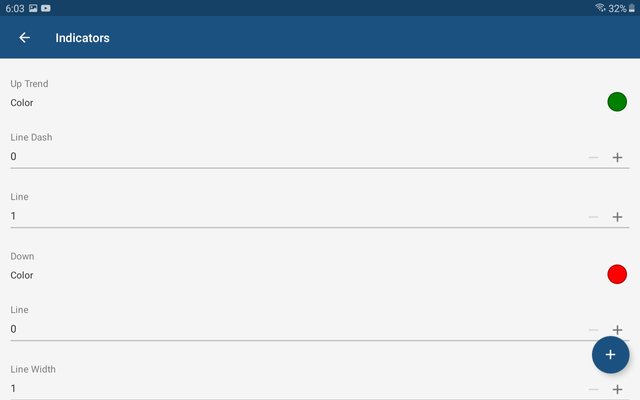
Input the period, multiplier, uptrend color, downtrend color, how thick their lines will be. As shown below.
This was done on a daily time frame.
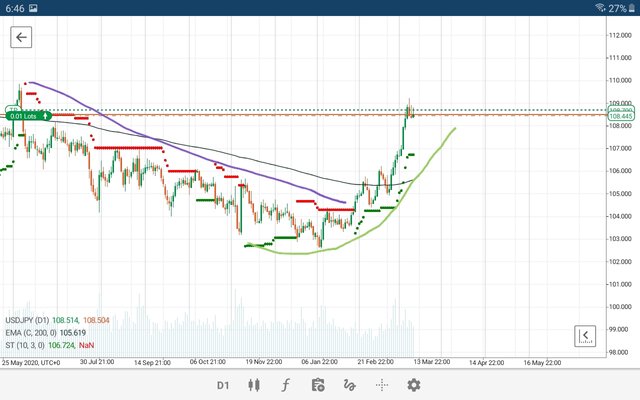
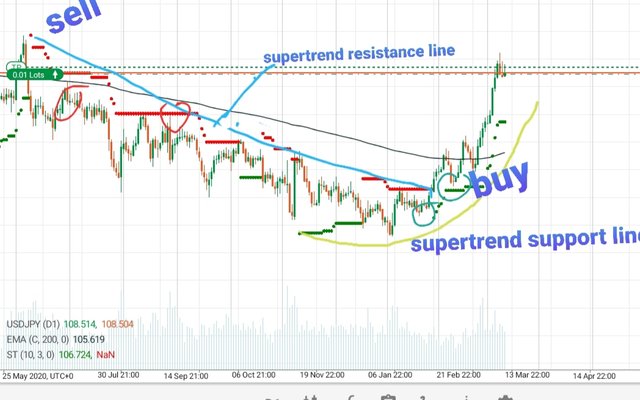
The sceenshot below, shows the supertrend lines.
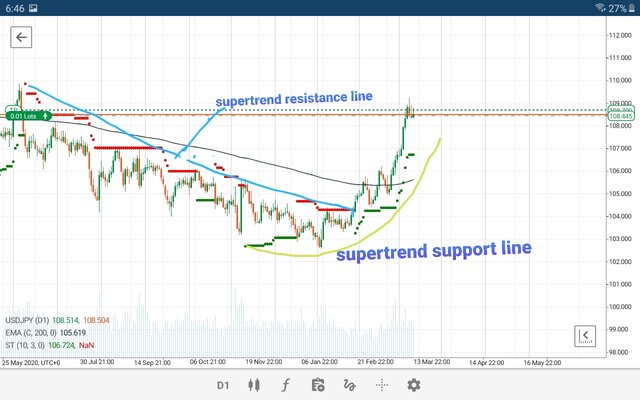
From the pictures below, the sell line is indicated by red lines which is further outlined by the purple line, while the buy support line is the green lines, which is further outlined by the green lines.
How SuperTrend Shows Buy-Sell Indications? (Screenshot Needed)
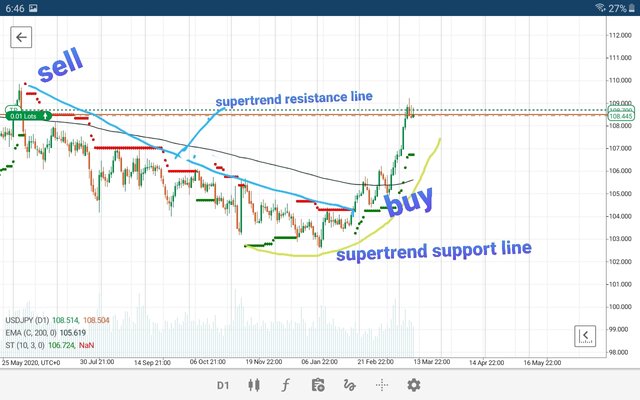
We can see the red lines above the price, indicated clearly by the purple line. Once it is like that it is an indication of a sell., when the line is below the price as indicated be the green lines, it is an indication to buy.
The screenshot below show that.
When We can place a Buy Trade with the help of SuperTrend Indicator? (Screenshot Needed)
Where to initiate a trade whether buy or sell is clearly illustrated by the screenshot below.
The red circles are points where we can enter the trade as a sell trade, while the green circles are points we can enter a buy trade.
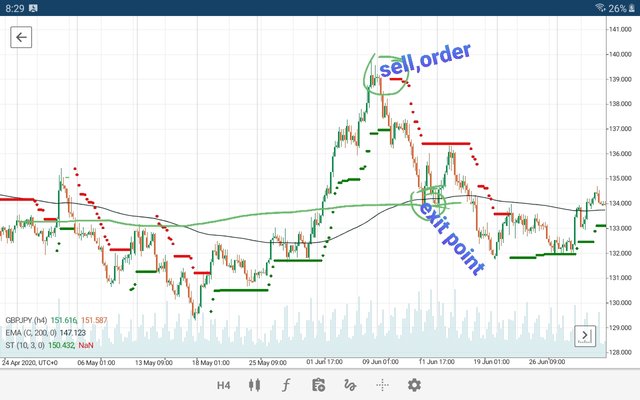
When we can place exit/square off, sell order with the help of SuperTrend Indicator? (Screenshot Needed)
From the picture above, if we take a trade at 139.000 level, the trader should square off at the point marked exit point. From this time frame that is a very strong support level before that time. The square off can also take place at 137.000, depending on the type of trader.
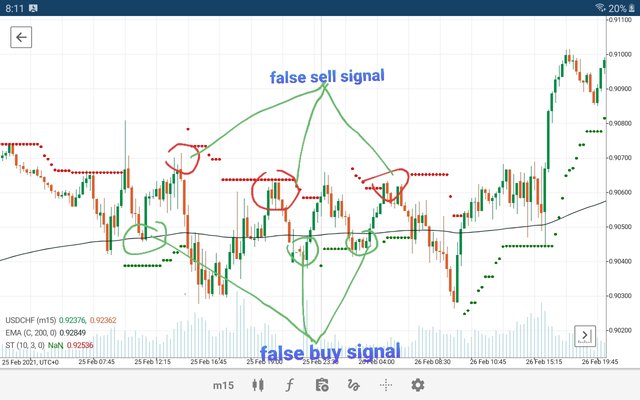
How false indications look in SuperTrend Indicator? (Screenshot Needed)
From the screenshot above, the various points circled in red color are false sell signal just like those circled in green are also false buy signal. At this point the market is ranging, and a trader can only trade within the resistance and support line until there is a breakout in either of the direction.
According to your view what Stoploss you will suggest?
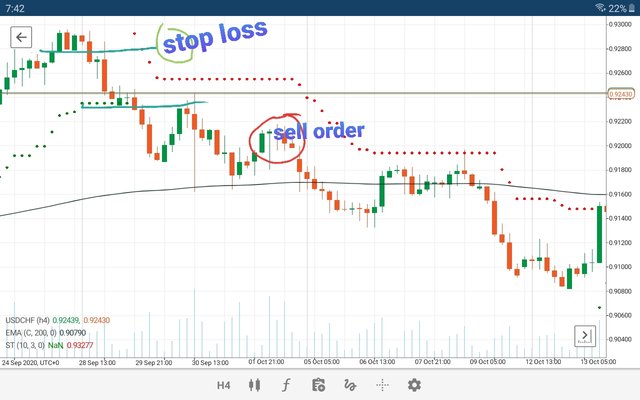
Screenshot on where to place stoploss.
The picture below shows where I will exit the in any case of reversal in the market. The green lines represent resistance levels or points. If a trader places a sell order from the place I circled, I will exit the trade at the second resistant level marked stop loss. However this is clearly dependent on my equity.
Conclusion
From this lecture, I have learned so much about supertrend and how it can help me make my trades more profitable. It has given me a very down to earth explanation on this indicator and how make good use of it. Thank you @stream4u and steemit.com in general.
Cc: @steemcurator01
Cc: @steemcurator02
Cc: @stream4u
I am a member of @steemalive community

Subscribe:::Discord.
:::Whatsapp :::**[join trail](https://steemit.com/hive-167622/@steemalive/how-to-join-steemalive c
Hi @benton3
Thank you for joining Steemit Crypto Academy and participating in the Homework Task 5.
Your Homework task 5 verification has been done by @Stream4u.
Thank You.
@stream4u
Crypto Professors : Steemit Crypto Academy