[ENG- ESP] HOMEWORK: Steemit Crypto Academy | Why Technical knowledge is Important in Trading and How To Read, Understand The Technical Chart? // No entra el título en español :)
Nuevamente dejo la versión en Español en la segunda parte para mis compatriotas latinos de habla hispana. Espero que les sirva!
[ENGLISH]
Why Technical knowledge is Important in Trading and How To Read, Understand The Technical Chart?
This class has been great for me !! Just about a month ago, I have started buying and selling on Binance. I don't know if I would call it trading, because it has been mostly an exploration based on a very toolless analysis of the candlestick chart.
Of course, I have lost some money, little, because I am very careful with these things and really what I wanted was to "learn by doing", in something that was a bit like a game.
However, as I noticed that I didn't know how to handle it, I decided to wait and better analyze the price rises and falls. Just then, #steemit announced that cryptocurrency courses would be held, so you can imagine how happy I am.
My explanation based on what was dictated by the teacher @stream4u
Trading is not a game (although I have to recognize that when I have tried it, I have had so much fun that I have felt a bit that way), since you are using real money to do it, and as the professor said, as well as you can win, you can lose. Of course, who doesn't risk doesn't win, but ... risking blindly is not a good option either, because you would leave the possibility of winning to chance, when in fact you can make certain speculations with a good analysis of the graph.
That is why I think it's very important to think about the level of risk that you are willing to accept (and that you can handle), and I also think it is quite useful to determine a loss limit. That is, leave a margin available for trading, but at the same time know that if it reaches a certain economic amount, you will not continue trading.
Anyway, this is also something questionable and very necessary to analyze, since you could be stopping trading in a moment before the curve starts to rise, and then really losing your money for impatience (this has happened to me, that's why now what I try to control the most are the impulses, the fears or the extreme satisfaction of winning a little more since that can play very against).
What is the role of a Technical chart?
I could say that the role of the graph is to show the fluctuations that a certain cryptocurrency is going through so that the trader can make a decision. This decision will be to buy or sell and will be supported by the knowledge that the person has about the analysis of the graph.
Why do you think Technical knowledge is important?
Because it allows me to analyze if the currency is rising or if it is losing value. I can also choose the period of time to analyze and see if it is a temporary low (15 minutes or one hour), or if it has been going down for more than 1 day. That could indicate to me that perhaps this is not the time to buy.
Knowing this also allows me to reduce the risk of loss that exists in the trading action itself.
Uptrend or downtrend, which one is good for buy a coin, explain why?
I think the best time to buy is with a downtrend. But what you have to do is observe the previous lower limit of the curve and wait for the price to approach that value, since from there it is speculated that the curve will rise again and the trend will be upward. Otherwise, you would be buying in the middle of a bearish period, so you are going to lose something, and then you don't know very well how far the curve will rise, which could result in zero profit or loss (I say this from experience, haha)
However, when there is an uptrend, if you detect that it has only just started, that would also be a good time to buy, since there is a good chance that it will continue to rise a little more and you can make a profit.
Check any Crypto Coin technical chart and explain what you find/understood from the Chart with screenshots.
BTC/ USDT graphic
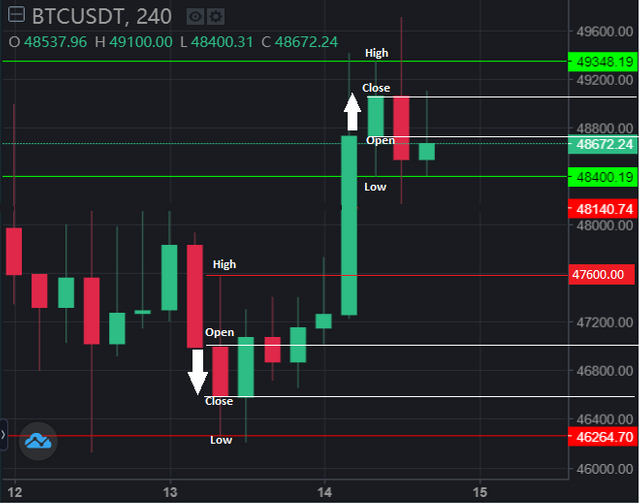
Here I did an analysis of the graph, a little from Binance, and a little modified it on Paint. It is observed that the selected red candle presented a maximum value of around 47600.00 USD, opened at approximately 4700.00, closed at 46600.00, and presented a lower limit of 46264.70, presenting a low period.
On the other hand, the selected green candle presented a lower value of 48400.19, opened at almost 48700, closed at around 49100.00, and had a maximum value of 49348.19, showing a bullish moment.
Variation presented in 1 day
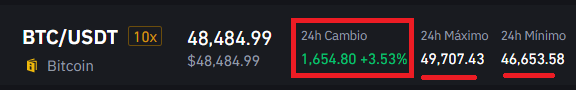
This is something that is also important for me to see, if in 24 hours there is a positive percentage (the cryptocurrency is in a bullish period) or negative (on the contrary, in one day it has lost value). In this case, BTC presents a positive variation of 3.53%.
Fraction of time in which you can see the opening and closing time
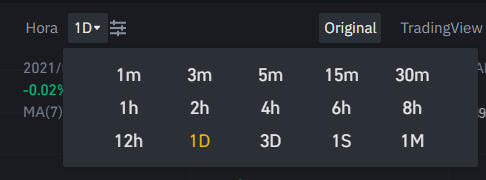
You can analyze it in 15 minutes, 2 hours, 4 hours, 6 hours, 1 day and more. For trading, from my point of view, it is better to take shorter periods to analyze, if you are looking for a faster profit. It also depends on the rate of change of the currency. 15 minutes could be a good value, but 1 hour, 2 or 4 as well. In case you are going to be observing the graph, 15 minutes seems the most useful to me to take in detail the moments of growth and decrease.
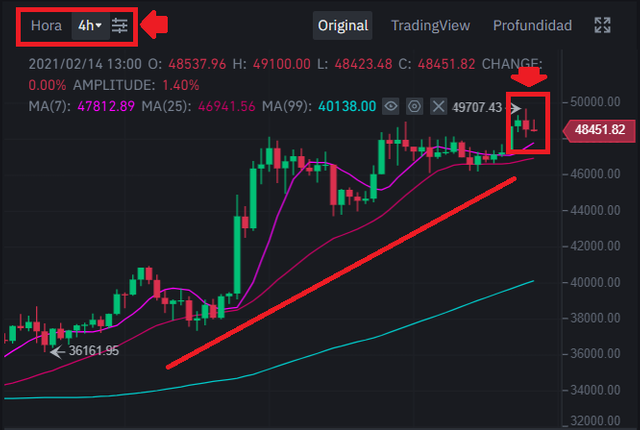
Next, you can observe how the fraction of time that I select can throw us the wrong glances of the moment in which I'm observing the graph for trading.
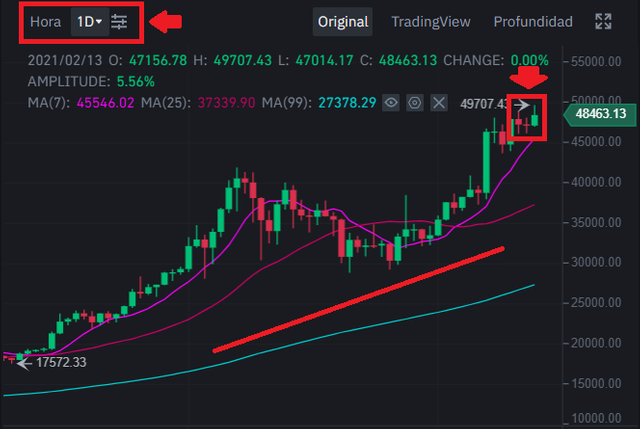
For example, in the chart above, corresponding to BTC / USDT, a bullish period is observed in 1 analyzed day, so it could indicate to me that it is a good time to buy.
However, if I modify the analyzed time fraction and turn to observe the 4-hour variation, I see a bearish period. Therefore, perhaps you should continue to lower the analyzed time fraction to see what is happening right now.
This also varies a lot depending on how long you are willing to trade, if you see that according to the dynamics, in one day it will go up, you can leave your money there and wait until the next day to obtain your profit. If you want something faster, the analysis should correspond to the time you expect to get the surplus.

This is all for today, my friends !! Thanks for this course !! It was great @ stream4u!!
Cc-
@steemitblog
@steemcurator01
@steemcurator02
@stephenkendal
.png)
ESPAÑOL
¿Por qué el conocimiento técnico es importante en el comercio y cómo leer y comprender el cuadro técnico?
Esta clase me ha venido genial!! Justo desde hace alrededor de un mes, he empezado a comprar y vender en Binance. No sé si lo llamaría trading, porque ha sido más que nada una exploración en base a un análisis muy falto de herramientas del gráfico de velas.
Por supuesto, que he perdido algo de dinero, poco, porque soy muy cuidadosa con estas cosas y en realidad lo que quería era "aprender haciendo", en algo que era un poco como un juego.
Sin embargo, como noté que no sabía manejarlo, decidí esperar y analizar mejor las subas y bajas de precios. Justo en ese momento, #steemit anunció que se dictarían cursos de criptomonedas, así que imaginarán lo feliz que estoy.
Mi explicación en base a lo dictado por el profesor @stream4u
El trading no es un juego (cuando lo he intentado, me he divertido tanto que lo he sentido así), ya que estás utilizando dinero de verdad para hacerlo, y como bien dijo el profesor, así como podés ganar, podés perder. Claro que el que no arriesga no gana, pero... arriesgar a ciegas tampoco es una buena opción, porque dejarías en manos del azar la posibilidad de ganar, cuando en realidad sí podés hacer ciertas especulaciones con un buen análisis del gráfico.
Por eso creo que es muy importante pensar *cuál es el nivel de riesgo que uno está dispuesto a aceptar (y que puede manejar), y también creo bastante útil, determinar un límite de pérdida. Es decir, dejar un margen disponible para el trading, pero al mismo tiempo saber que si llega a cierto monto económico, no seguirás haciendo trading.
De todas maneras eso también es algo cuestionable y muy necesario de analizar, ya que podrías estar dejando de hacer trading en un momento previo a que la curva empiece a subir, y entonces perder realmente tu dinero por impaciente (esto me ha pasado, por eso ahora lo que más intento controlar, son los impulsos, los miedos o la satisfacción extrema al ganar un poco más, ya que eso puede jugar muy en contra).
Cuál es el rol del gráfico?
Habiendo dicho esto, podría decir que el rol del gráfico es mostrar las flucuaciones que va atravesando determinada criptomoneda para que el trader puede tomar una decisión. Esta decisión será comprar o vender y se verá sostenida por el conocimiento que la persona tenga sobre el análisis del gráfico.
¿Por qué crees que el conocimiento técnico es importante?
Porque me permite analizar si la moneda está en alza o si está perdiendo valor. Además puedo elegir el período de tiempo a analizar y ver si se trata de una bja temporal (15 minutos o una hora), o si lleva más de 1 día bajando. Eso me podría indicar que quizás ese no sea el momento de comprar.
Conocer esto además, me permite disminuir el riesgo de pérdida que existe en la propia acción de trading.
Tendencia alcista o bajista, cuál es buena para comprar una moneda, explica por qué?
Pienso que el mejor momento para comprar es con una tendencia bajista. Pero lo que hay que hacer es observar el límite inferior anterior de la curva y esperar que el precio se acerque a ese valor, ya que de allí se especula que la curva volverá a subir y la tendencia será alcista. De lo contrario, estarías comprando a la mitad de un período bajista, por lo que algo vas a perder, y después no sabes muy bien hasta dónde se elevará la curva, pudiendo resultar en ganancia o pérdida nulas (lo digo por experiencia, jahja)
Sin embargo, cuando hay una tendencia alcista, si detectas que recién ha empezado, ese también sería un buen momento para comprar, ya que hay muchas probabilidades de que siga subiendo un poco más y puedas obtener una ganancia.
Consulte cualquier cuadro técnico de Crypto Coin y explique lo que encuentra / entiende en el Cuadro con capturas de pantalla.
Tomé todas las capturas de Binance
Gráfico de BTC/ USDT
Acá realicé un análisis del gráfico, un poco desde Binance y otro poco lo modifiqué en paint. Se observa que la vela roja seleccionada presentó un valor máximo de alrededor de 47600.00 USD, abrió en aproximadamente 4700.00, cerró en 46600.00 y presentó un límite inferior de 46264.70, prsentando un período de baja.
Por otro lado, la vela verde seleccionada presentó un valor inferior de 48400.19, abrió en casi 48700, cerró en alrededor de 49100.00 y tuvo un valor máximo de 49348.19, mostrando un momento alcista.
Cambio presentado en 1 día
Esto es algo que también me resulta importante ver, si en 24 horas hay un porcentaje positivo (la criptomoneda se encuentra en un período alcista) o negativo (por el contrario, en un día ha perdido valor). En este caso BTC presenta una variación positiva del 3,53%.
Fracción de tiempo en que podés ver el momento de apertura y de cierre
Podés anlizarlo en 15 minutos, 2 horas, 4 horas, 6 horas, 1 día y más. Para hacer trading, desde mi punto de vista, es mejor tomar períodos más cortos para analizar, si se está buscando una ganancia más rápida. También depende de la velocidad de variación de la moneda. 15 minutos podría ser un buen valor, pero 1 hora, 2 o 4 también. En caso de que vayas a estar observando el gráfico, 15 minutos me parece lo más útil para llevar detalladamente los momentos de crecimiento y decrecimiento.
A continuación, se observa cómo la fracción de tiempo que seleccionamos puede arrojarnos miradas erróneas del instante en el que estamos observando el gráfico para hacer trading.
Por ejemplo, en el gráfico que se encuentra arriba, correspondiente a BTC/USDT, se observa un período alcista en 1 día analizado, por lo que a mí me podría indicar que es un buen momento para comprar.
Sin embargo, si modifico la fracción de tiempo analizada y paso a observar la variación de 4 horas, se ve un período bajista. Por lo tanto, quizás debería seguir bajando la fracción de tiempo analizada para ver qué está pasando en este momento.
Esto también varía mucho según el tiempo que estés dispuesto a hacer trading, si ves que según la dinámica, en un día va a subir, podés dejar tu dinero ahí y esperar hasta el otro día para obtener tu ganancia. Si querés algo más rápido, el análisis debe corresponder al tiempo en que esperes obtener el excedente.
Esto es todo por hoy mis amigos!! Gracias por este curso!! Ha sido genial @stream4u!!
Cc-
@steemitblog
@steemcurator01
@steemcurator02
@stephenkendal

Shared on Twitter
#promo-steem postpromotion #steemit
Thank You For Showing Your Intrest to learn Crypto Trading Technical knowledge.
You have completed the homework task and made a good post, explained very nicely about why Technical knowledge is important in Trading and How to read and understand Trading charts?
Remark: Homework Task Completed.
Thank You.
@stream4u
Crypto Professors : Steemit Crypto Academy
#india #affable
Thanks a lot dear professor!!
Excelente explicación, te cuento que tengo un mes haciendo el curso (pagado),. Lo pague con mis recompensas de steemit y pues, invertir en la mente es lo mejor, se aprende mucho, sobre todo el analisis grafico y control de emociones. Mucho exito amiga. Saludos desde Venezuela
Gracias amiga por la información detallada y con palabras que se pueden entender :)