Crypto Academy / Season 3 / Week 2 - Homework Post for professor @reminiscence01
Introduction
A chart is a pictorial representation of information using various elements, arranged in a standardized form to pass information. Charts in trading represent the interaction between buyers and sellers represented in a graphical to show the value of an asset, this correlates to the actual price of the asset in real-time.
There are various types of charts used in trading the include: a candlestick chart, market profile chart, bar chart, line chart, etc.
The Japanese Candlestick Chart
The Japanese candlestick chart comprises an element called candlestick that represents the movement of price within a specified time. A candlestick is made up of six essential parts the include the High, open, close, low, shadow, and real body. Each of the mentioned parts presents a flow of price within a specified time.
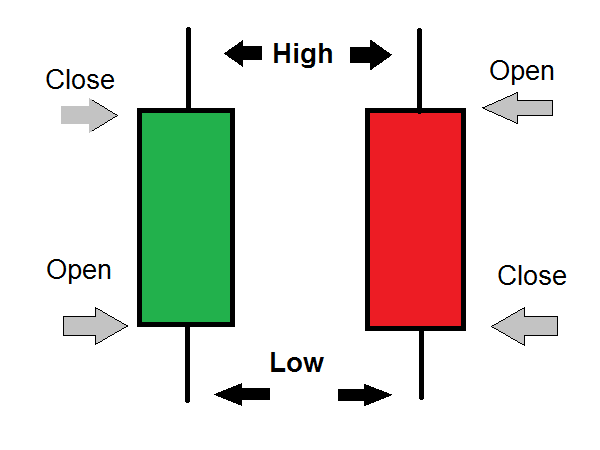
Image Source
High:-
This is a part of the Japanese candlestick that shows the peak of price movement within a defined time. It is characterized as the top end of the top shadow.
Open:-
The open of a candlestick is associated with the opening price of that candlestick, the point from which other market data is recorded within a specified time.
Close:-
The close of a candlestick is associated with the ending price of a candlestick. The close of a candlestick is important, as it hints at the future reactions of the market.
Low:-
This part of the Japanese candlestick shows the least price observed within a specified period. It is Characterized as the bottom end of the bottom shadow.
Shadow:-
A shadow highlights the various areas reached by the price but failed to close in those areas. It is characterized by a short vertical line on both ends of a candlestick.
Real body:-
The real body of a candlestick is the range of price between the opening price and the closing price. It is an important feature of the candlestick that indicates volume.
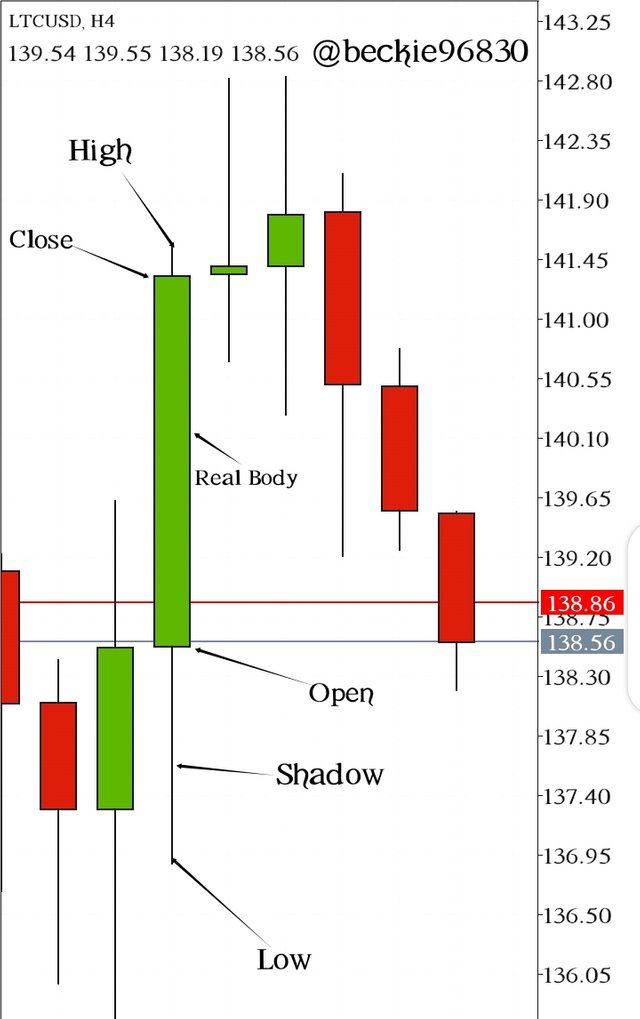
Describe any other two types of charts? (Screenshot required)
Source
As earlier mentioned, there are other types of charts for price representation, I will be explaining the line chart and bar chart.
Line chart
A line chart is a form of graphic price representation characterized by the use of connecting line to represent price movement plotted using the close of price within a specified time. A line chart is easy to understand, and it is used to cancel out indecision usually represented by candlesticks shadows.
Traders use the line chart to spot areas of interest(Resistance and Support levels). Consequently, line charts do not provide adequate information about the market since it is developed with only the closing price of an asset, thus trading using only the line chart can be disastrous.
Bar chart
The bar chart is a graphical representation of price shown in form of bars characterized by a vertical line with shot horizontal protruding on both sides of the line. The bar is similar to a candlestick in terms of what they represent but is different in form.
Bar charts indicates the Open, High, Low and Close of price within a specified time. Some trades prefer bar chart to candlestick because of less emotional form of representation.
Why Candlestick is mostly used
The Japanese candlestick chart is generally accepted by traders because of how it represents price, showing analytical details in form of High, open, low, close. Unlike any other price chart, the candles account for the trader's emotion through the representation of the tussle between buyers and sellers in form of shadows.
Candlestick offers traders significant information about the price that can be further improved on through candlestick analysis, thus improving trading decisions.
Candlestick analysis is the foundation of technical analysis, market structure, chart patterns, and candlestick patterns. They were developed from observation of price movement through candlesticks.
Identifying candlesticks
As stated in the lecture, candlesticks are classified based on the side of price movement they represented. The up movement of price is associated with bullish candles and the down movement of price is associated with bearish candles.
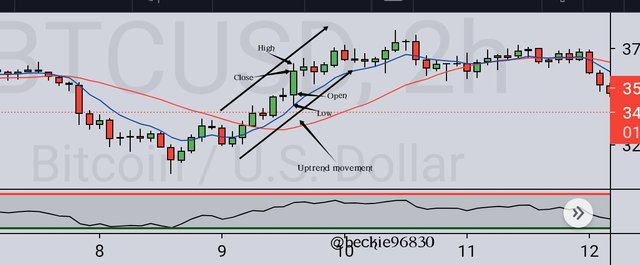
Bullish Candlestick
A bullish candlestick is a candlestick that represents the up movement of price in the market, the opening price is below the close price indicating an increase.
Multiple consistent formation of bullish candles creates what is known as an uptrend, characterized by each candle continuing from the next (closing price) point, moving upwards.
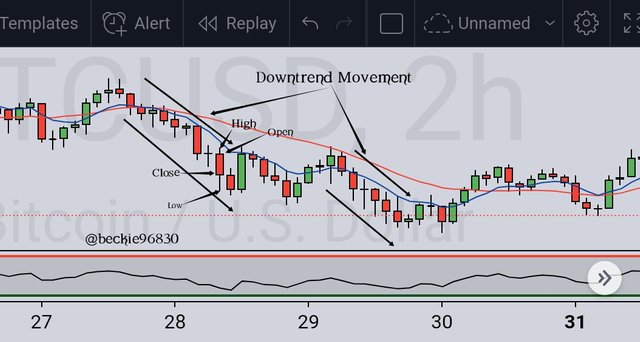
Bearish Candlestick
A bearish candlestick is a candlestick that represents down movement of price in the market, the opening price is above the closing price indicating a decrease in the price of the asset.
Consistent multiple formations of bearish candlestick what's known as a bearish trend, characterized by each candle continuing from the next (closing price) point, moving downwards.
Conclusion
Price charts the reaction of buyers and sellers within a market thus helps to further understand market psychology and potential ways to capitalize on opportunities.
Candlestick is a helpful tool in trading because of the quality of information it indicates. As noted, it forms the basis of technical analysis, chart patterns, and candlestick patterns.
Understanding how to read a candlestick will improve a trader's experience.
Thank you professor @reminiscence01 for this wonderful lecture.
Hello @beckie96830, I’m glad you participated in the 2nd week of the Beginner’s class at the Steemit Crypto Academy. Your grades in this task are as follows:
Recommendation / Feedback:**
Thank you for submitting your homework task.
Thank You professor @reminiscence01.