Steemit crypto Academy| Course By @ stream4u- All About Price forecasting.
Hello Everyone,
My sincere gratitude to our professor @stream4u for the great lecture. It is actually my first time posting here, and i will try to give my best about the homework on price forecasting.

Question1&2: What is price forecasting? Why is price forecasting needed?
In cryptocurrency, price forecasting is the process of foretelling what the value of an asset or a product will be in the near future and this could be short-term or long-term. Price forecasting can be done by looking at the demand for that particular asset or product, using past information or chart to make estimates on what the trend of an asset will look like, in the near future.
Price forecasting can help a company a lot, especially in decision making. It can help a company to know the exact time to purchase a particular product and when to sell it off in other to maximize profit.
It can also help a company make solid decisions that will help reduce uncertainty and also improve communication internally among the company and business partners.
Price forecasting can help a company know the exact amount that will be allocated to a purchase of a particular asset or product. It can also help a company know the positive or negative effect of an increase or decrease in the price of a particular asset on a company. Price forecasting can make a business become successful or make it fail when wrong decisions are made. Price forecasting gives a company more idea or information about a particular asset being purchased.
Question 3: What is the Best Method for Price prediction/forecasting.
There are basically 3 methods for price prediction, they are Sentimental analysis, Technical analysis and Fundamental analysis. Let me Explain them a bit.
- Technical analysis; Just like a saying i have heard " History repeats itself" most technical traders / analyst uses the market value of an asset in the past to predict or foretell what an asset price will be in the future. They follow previous uptrend and downtrend, price charts and market statistics to give a prediction which may be fairly accurate. The past information about assets will enable them to invest or purchase an asset.
- sentimental Analysis; A trader uses his thoughts or personal thinking to determine what the price of an asset will be . This is based on probability and can lead to loss. This method is a very risky one. The trader gets information from social media, based on reviews from trading market forum to detect if a particular asset is satisfactory or not. Based on the reviews from trading market forum, he can decide either to invest or not to invest in a particular asset.
- Fundamental analysis; it is the use of a company's administrative records, GDP, Relationship with customers, projects successfully accomplished and other external factors such as global news on pandemic, country's policy change that affected the financial market, to determine the price of an asset in the near future.
For me, the Best method to use is the Technical and Fundamental methods. These methods have helped most traders and company's to maximize profit in the past and present.
Question4;Take any crypto Asset chart graph and explain how to do price forecasting? OR Take any crypto Assets chart graph & as per its current price tell us what will be its future price for next 1 week or 1 month? You can predict for any direction up or down but explain it properly on what basis you have predicted the price.
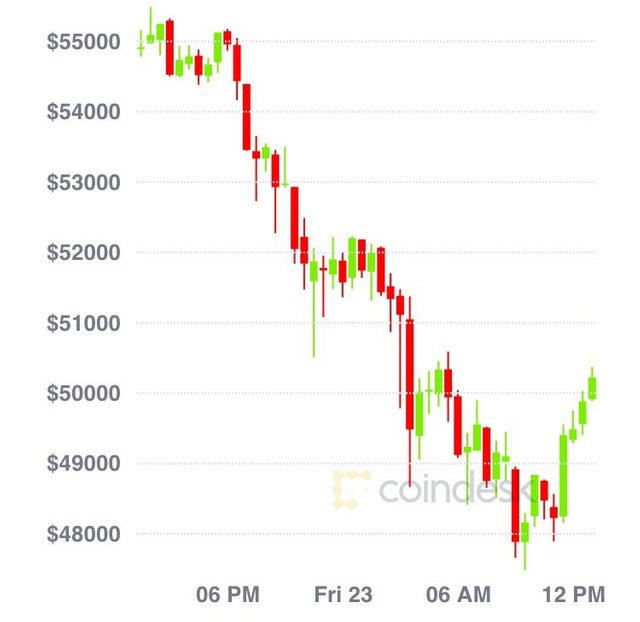
I shall use the bit coin chart graph to illustrate based on its current price.

Source;
https://www.coindesk.com/price/bitcoin
The above is the current price of Bitcoin as of yestetday and today. Indeed its obvious that the price is depreciating from the graph. Its currently $52,000 from my observation due to demands and supply. It has kept on reducing from the graph above. I will like to use a fibonacci sequence to predict the growth of bitcoin in the next one week. We know that the sequence are; 0,1,1,2,3,5,8,13,21,34,55,89,144,233,377,610,987,1597,2584........(pattern repeats to infinity).
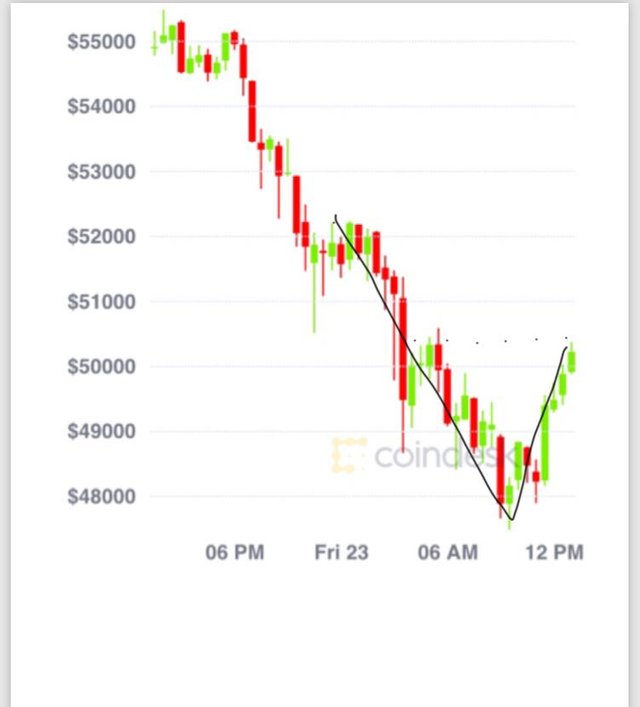
Each number in the sequence is derived from the sum of the preceding two numbers. Not only that, but each number is roughly 1.618 times greater than the number before it. This creates a value known as the "golden ratio" or "phi". In finding support or before using the fibonacci tool to identify potential support or resistance levels, we need to be able to identify a " swing high" and " swing low" . A swing high is simply a candlestick at the peak of a trend in any time frame that has a lower high directly to its right or left. Conversely, a swing low is the low candlestick of a trend with a higher low on each side. In the above graph, i shall find the potential resistance level by connecting the swing high to the swing low. The retracements will appear by dividing the distance from the peak to the trough using the ratio in the fibonacci sequence or 50%.

The graph chart above Is a clear indication of the swing up and down from the rough sketch.
Conclusion
Price forecasting helps to maximize profit and reduce risk. Understanding the fundamental and Technical analysis can help to predict price of assets accurately.
Thanks to @stream4u
Hi @beautiefair
Thank you for joining The Steemit Crypto Academy Courses and participated in the Week 10 Homework Task.
Your Week 10 Homework Task verification has been done by @Stream4u, hope you have enjoyed and learned something new.
Thank You.
@stream4u
Crypto Professors : Steemit Crypto Academy
Thank you very much prof. I hope to improve