Crypto Academy Week 16 - Homework Post for @stream4u


INTRODUCTION
A crypto trader always knows his tools and ways. Technical analysis is a skill that any trader ought to have in order to make the best of the market opportunities. The use of pivot points is just one of many strategies that traders use often. Professor @stream4u has done really well breaking the subject down to really simple concepts. Now, I would demonstrate my understanding of the topic.
Pivot Points
Pivot point is a really popular and helpful technical analysis tool that helps to show market trends in a particular period. The pivot point is really just a price level that is accompanied by various support and resistance levels. These levels are calculated with consideration of vital price levels of the previous period like high price, low price and closing price.
It’s said that pivot points can be used in any timeframe but in most cases they are used in intraday trading. Traders employ them because they calculate risk unlike the commonly used RSI and MACD tools.
Like other trading tools, there are different types of pivot points. The 5 major types of pivot points commonly used include:
- Traditional Pivot Point
- Classic Pivot Point
- Camarilla Pivot Point
- Woodie’s Pivot Point
- Fibonacci Pivot Point
- Demark Pivot Point
Among these 5, the most used is the Traditional Pivot Point.
Details about Pivot Point Levels
As already stated above, the pivot point indicator consists of different levels. The image below shows an illustration of the different levels:
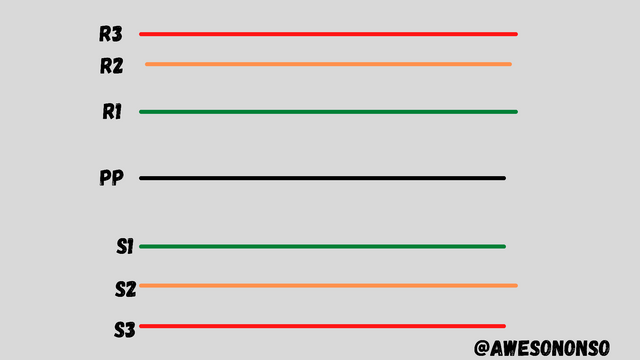
Now let’s look at these points one by one:
Main Pivot Point level (PP):
The main Pivot level is the level that determines the market trend for the current period. It is the center line in the tool. Price above this level indicates an uptrend (bullish) while price below it indicates a downtrend (bearish).
Resistance levels:
Resistance levels are price levels above the Main Pivot Point level. These levels act as resistance that can cause a reversal of an uptrend or a breakout when it broken through. Various resistance levels include:
Resistance 1 (R1): This is the first resistance level located right above the PP level.
Resistance 2 (R2): This level is the second resistance level. It is located right above R1.
Resistance 3 (R3): This level is the third resistance level. It is located right after R2.
R4 and R5 follow the same trend as the first three.
Support levels:
Support levels are price levels found below the Main Pivot Point Level. These levels act as support to the price of the asset. When price touches these points, it either causes a bullish reversal or a breakout to continue the downtrend. Various support levels include:
Support 1 (S1): This is the first support level right below the PP level.
Support 2 (S2): This level is the second support level that is located after S1.
Support 3 (S3): This level is the third support level. It is located right after S2.
S4 and S5 follow the same trend as the first three levels.
Different pivot point level calculations
For calculating the different pivot point levels, I’m going to be using the Traditional Pivot points.
Main Pivot Point Level (PP): This is calculated as the average of the Highest, Lowest and Closing prices of the prior day. The simple formula is given below:
PP = (High + Low + Close)/3
Now let’s look at the support and resistance levels:
R1 and S1
R1 = (2 x PP) – Low
S1 = (2 x PP) – High
R2 and S2
R2 = PP + (High – Low)
S2 = PP – (High – Low)
R3 and S3
R3 = High + 2(PP – Low)
S3 = Low – 2(High – PP)
There are a number of different methods for calculating the levels. Just for reference let’s look at the Woodie Pivot Point.
Now, the Woodie Pivot Point doubles the Closing price before taking the average for PP. The formula is given as:
PP = (H + L + 2C) / 4
Calculation of the support and resistance levels from here is similar to the Traditional.
How to Apply Pivot Point on a Chart
For this task I would be using TradingView. The steps for applying pivot point are as follows:
Step 1: After loading a chart, Click on fx indicators at the top.
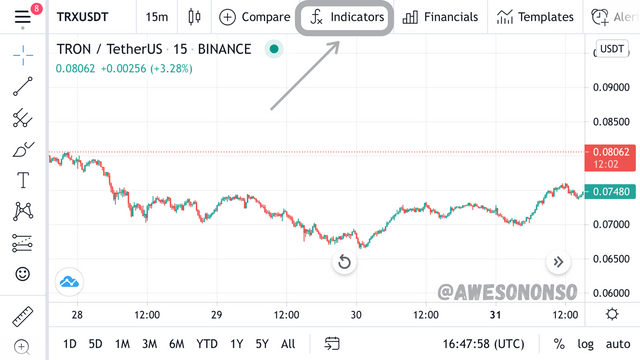
I chose TRX/USDT chart
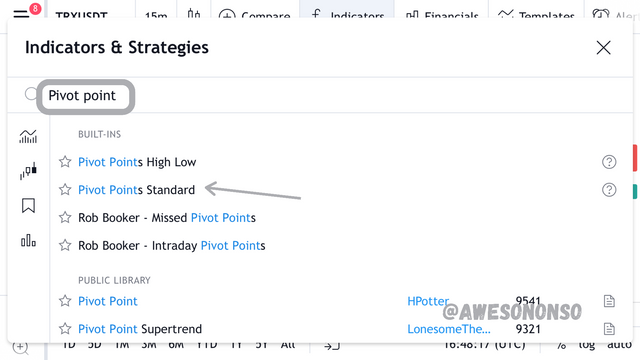
Step 2: Search “Pivot point” and select Pivot Points Standard.
Step 3: The indicator comes up but it the levels are not distinct. To configure the indicator, tap on it and click on the corresponding settings button.
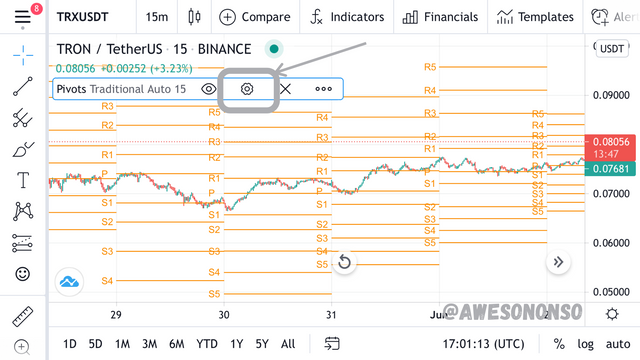
By default, all the levels are orange
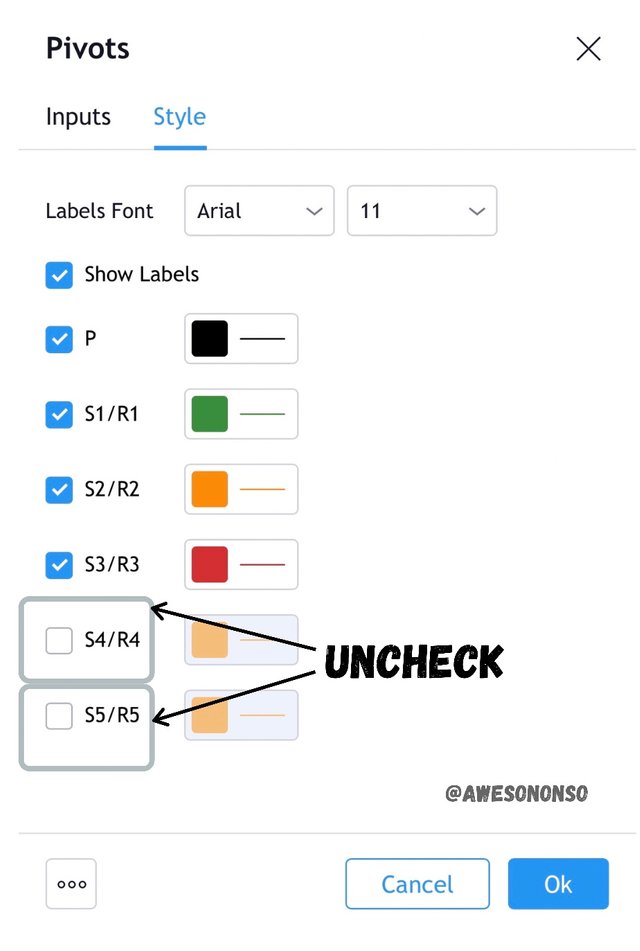
Step 4: We don’t change and setting under the input tab. Under the Style tab, some changes will be made.
First, deselect the 4th and 5th levels. These levels are not really necessary in a small timeframe. The price barely ever touches the 3rd levels anyway.
Second, Change the colors of the remaining levels to avoid confusions. The P level should be black preferably as a neutral zone. S1/R1 can be set to green while S2/R2 can remain as orange. S3/R3 can be red indicating extremity.
The settings
The result
How Pivot Points Work
A lot of traders rely a lot on pivot points. The indicator is very efficient in day trading. Below are some ways pivot points function:
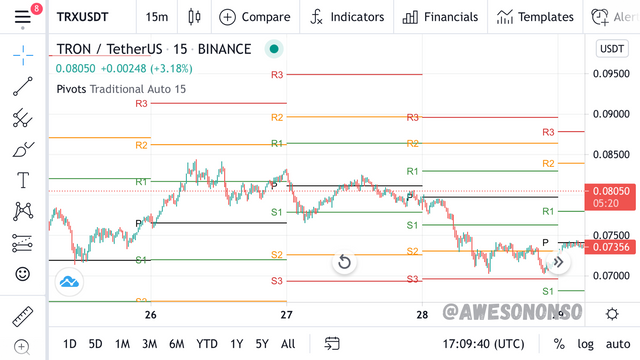
1. Trend indicator: The Main Pivot Point serves as a very effective trend indicator. Generally, if the price is above the PP level, then it shows an bullish trend. Similarly, if the price is below the PP level, then it shows a bearish trend
In the image above, at point A the market is in a downtrend because the price is below the PP level. At point B, the market is in an uptrend because the price is above the PP level.
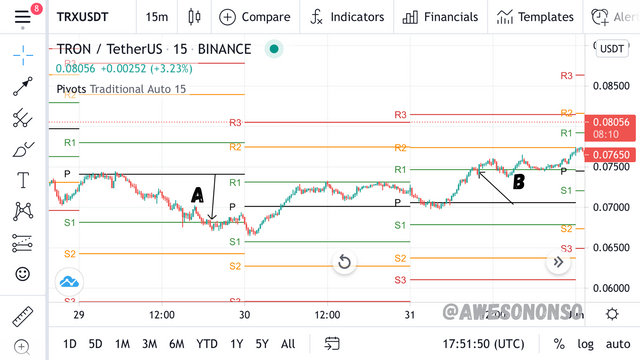
2. Resistance and Support: The Pivot Point indicator comes with Carefully calibrated resistance and support levels. When prices hit these levels, they can signal bounce backs or a breakout.
For example, a bounce back from a resistance level gives a sell signal while a breakout will signal a buy signal. The case is the other way for a support level.
Point C in the image above is a support level at S1 while point D is a resistance level at R1.
Reverse trading with Pivot Points
We have already explained how the Resistance and Support levels of the pivot point function. Now we will look at it in reverse trading (i.e when price bounces back instead of breaking out).
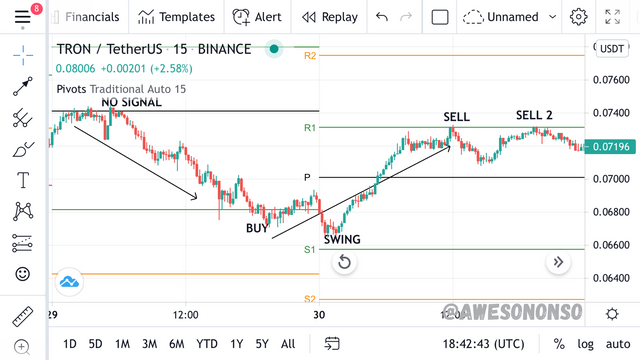
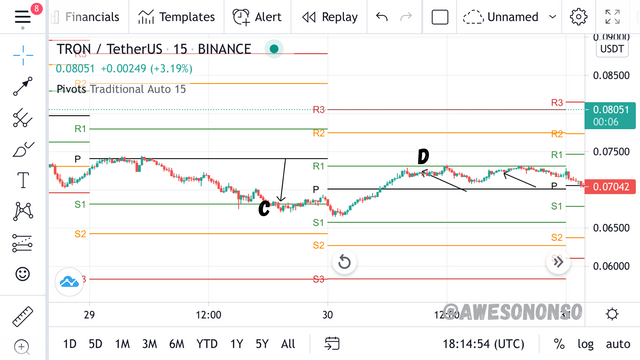
The chart above is TRX/USDT with a 15 minutes time frame.
At the beginning of the first day, the price was at a downtrend. When it touches the PP level, there is no signal so we wait for the price to touch a S1.
Once the price touches S1, traders would open a buy position. The position is risky because there really isn’t any confirmation. A swing even occurs before the trend finally starts to reverse.
Traders hold their buy position even after it touches and crosses the PP level. The price touches the R1 level after going into a bullish trend. There is a reversal signal because the opening price of the red candle is equal to closing price of the prior green candle. So at this point, traders open a sell position.
Traders that missed that sell position can get another chance at R1 when a tweezer top is formed. This is a stronger sell signal(Sell 2).
Common Mistakes
Although the Pivot point is a very useful trading tool, it can cause a lot of losses if not used correctly. Below are some ways traders make mistakes with pivot points:
1. Solely relying on the pivot points: Traders, especially newbies, rely on a single tool once they learn a few things about it. The same goes with pivot points. Some traders use only the pivot point tool in trading. They just use they basic law of support and resistance without combining it with patterns, other indicators, fundamental and sentimental analysis. This can cause a lot of avoidable losses.
2. Not differentiating the lines: By default, the lines of the different pivot levels are the same color. Some traders don’t bother changing the colors and this can actually lead to a lot of confusion. I, for one, get confused by similar colors. This can lead to reading wrong signals because the lines are misplaced.
3. No stop loss: This is a major problem among many traders. A lot of people trust the pivot points so much that they feel like a stop loss is unnecessary. This is bad because an intended bounce back can be a breakout and that can lead to major losses.
4. No knowledge of supply and demand: The basic laws Supply and demand move the crypto markets. A higher demand means that prices would go up while a higher supply means that prices would go down. Supply and demand levels are clearly indicated on volume indicators where a higher volume means a stronger movement on either side. Now, traders that don’t know the basic laws of supply and demand might just rely on instinct and knowledge of bounce backs. Let me explain with an image:
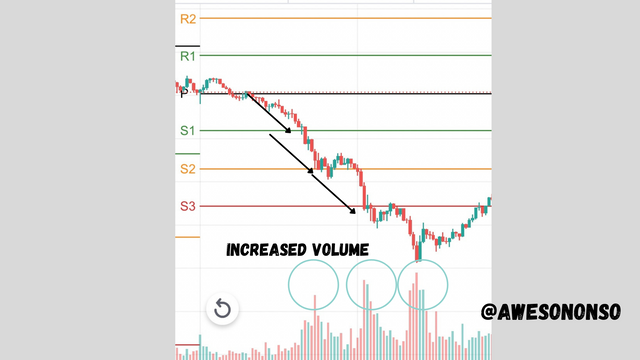
From the image above, Some traders would place a buy position when the price touches S1. These buyers would lose so much after the price breaks the S1 level. Some traders would still expect a reversal but would lose more after the price breaks S2 and S3. These losses would have been avoided if the trader observed the increased volumes that indicated high supply.
5. No clear strategy: Many traders just carelessly get into markets without have a clear cut plan. These traders make decisions by impulse because of the rush. These kind of traders make lots of mistakes because they clearly did not plan the whole trading process. A clear strategy starts from deep mental preparation all the way to execution. With a plan, a trader can stand firm in his decision even if the market seems to go wrong.
Advantages of pivot points
The pivot point is one of the many trading tools that have survived the test of time. Below are some of its advantages:
1. Easy to use: This tool is one of the easiest to use. It basically uses the general resistance and support laws. These days, they levels are even calculated. All you need to do is put up the tool and start trading.
2. Entry and exit determination: Knowing when and how to enter the market is something we can determine on the pivot point tool. Resistance levels are sell signals while support levels are buy signals. Also exit points can be determined the same. This, however should be done with caution in order to avoid losses.
3. Risk calculation: Unlike the RSI and MACD tools, the Pivot point tool can help traders weigh risk in trading. Using important relationships between high, low and closing prices, this tool captures critical price movements that can really help traders make the best decisions possible in a trade.
4. Small time frames: The pivot point tool works in small time frames like the daily time frame. With this tool, traders can leverage small timeframes and make profits from them.
Explaining Pivot points on a chart
For this task, I would also use the TRX/USDT pair chart.
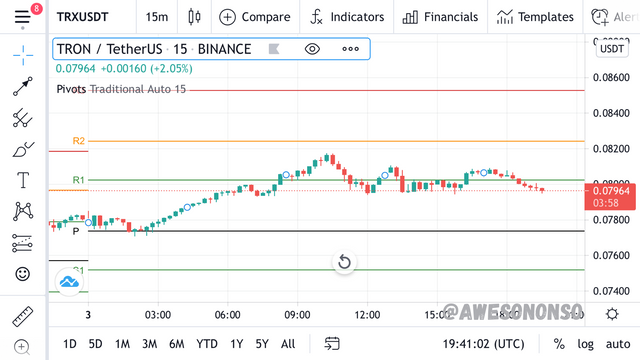
The chart screenshot was taken by 8:40pm, 3rd June, West African Time.
From the cart, the market started the day above the PP level with a bullish trend. It eventually got to the R1 level where some traders would have opened a sell position.
Instead of the price to bounce back, it broke the resistance continuing uptrend. Shortly after, it falls and forms a support a little below the R1 level at 0.07955 USDT.
Notice the new support at 0.07955 USDT
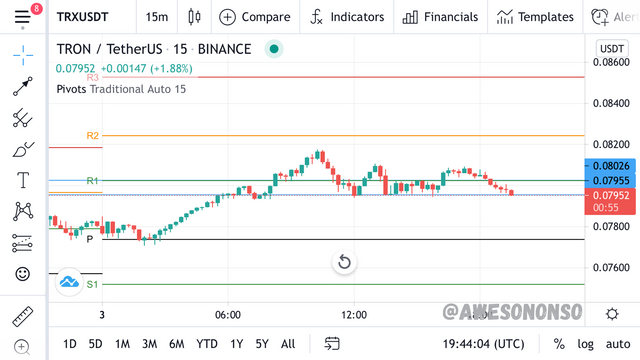
Looking at the chart closely, a bullish flag pattern is formed.
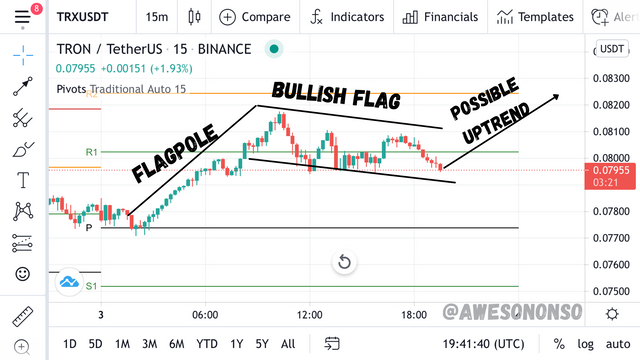
A bullish flag
This means that the price will not likely go lower than the current level rather it will paint the flag till it breaks into an uptrend. The uptrend might not occur today but it’s clear that there will be a major change on the pivot points for the following day. The current price area is a good buy spot.
Weekly Price Forecast for a crypto coin: Binance Coin (BNB)

BNB is the Binance exchange native coin. It was founded in 2017 and was sold at about $0.15 at binance’s ICO. Since its launch, the coin has risen over 360,000%.
BNB is a special type of coin. It is a utility token on the binance exchange that is used for paying trading fees and providing liquidity to other coins. The coin was initially launched on the Ethereum blockchain before it was moved to the Binance smart Chan (BSC) in 2019.
Why did I choose BNB?
Well, I have always been intrigued by this particular coin. BNB is a deflationary coin with so little supply. BNB was launched with 200 million coins pre-minted. As a deflationary coin, a percentage of BNB is supposed to burnt every quarter according to the Whitepaper. This burning will go on until there are only 100 million BNB left.
This burning coupled with the use case makes BNB a promising project. I did forecasts on BNB in previous assignments and my forecasts came fo past. I’m beginning to get used to the market.
Some stats of BNB as of writing
| Price | $415.91 |
| All Time High | $690.93 |
| Rank | #3 |
| Market cap | $63,819,259,998.53 |
| Trading volume | $4,247,388,142.56 |
| Curculating supply | 153,432,897 BNB |
| Total Supply | 169,432,897 BNB |
| Maximum supply | 170,532,785 BNB |
The forecast
Let us look at BNB/USDT pair chart. I will show the chart in three different time frames.
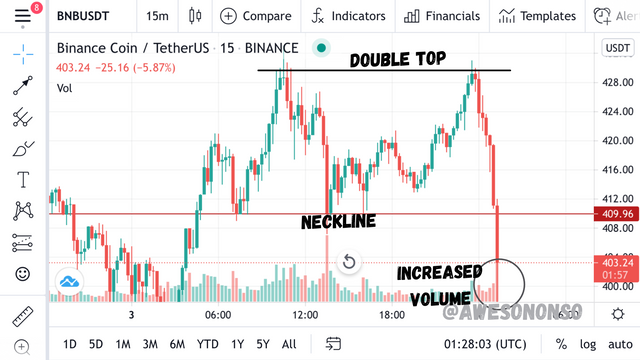
Above is the 15 minutes time frame of BNB. From the chart there is a clear double top pattern. Early traders would have seen this as an early sell signal. Notice that the price broke the neckline at 409.96 USDT. The volume increase confirms that the downtrend is real.
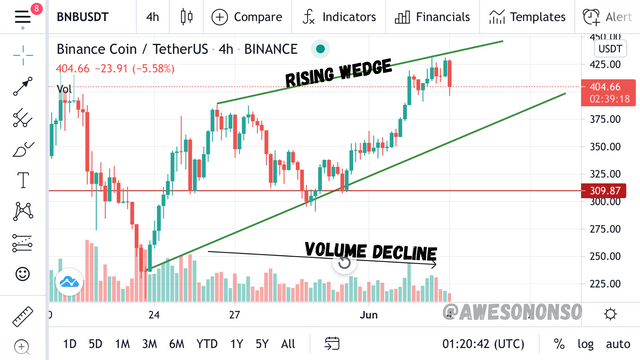
The image above shows a 4-hour chart of BNB. A rising wedge patter is clearly formed. This pattern normally indicates a reversal to a downtrend. I can confirm the pattern by the reduced volume. I market a support level at 309.84 USDT.
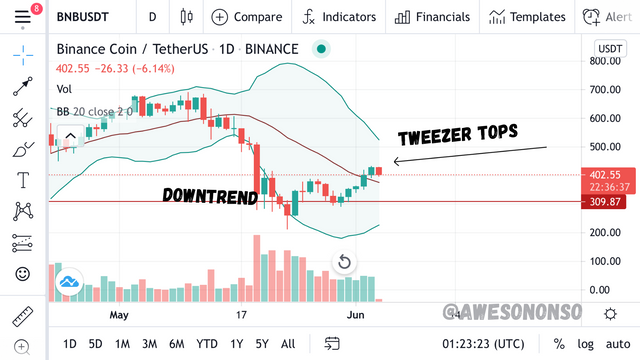
And lastly, above is the daily chart of the pair. A tweezer top is already forming. Tweezer tops are good indicators of reversal. The market is already in a downtrend as confirmed by the Bollinger bands. The breakout of price at the SMA center baseline might just be a fakeout and the prices would return to a downtrend.
My forecast conclusion
Considering all the data, I can say that the market would probably be in a downtrend for the next week. The rising wedge is just too clear to ignore. Below is how I think the price would go:
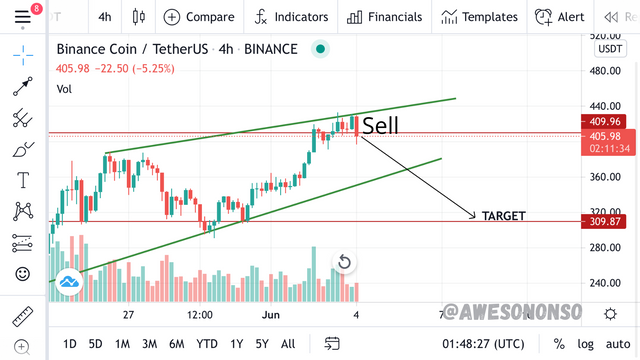
The movement is going to be a simple fall until it reaches the 309.87 USDT support level. If I were trading, I would open a sell position from the point shown.
CONCLUSION
Effective use of pivot points takes time and dedication to learn. If mastered properly, traders can really use them to make the most of their trades.
No matter the experience, traders should always be cautious when using the pivot point indicator. It is advisable to combine the tool with other indicators for confirmations.
On the aspect of the price forecast, the fundamental analysis around BNB shows that the coin would likely succeed more in the long run. Holders can keep holding for now. It’s not advisable for holders to take profit so that they don’t buy coins more expensive when the markets fail.
Special thanks to @stream4u.
Hi @awesononso
Thank you for joining The Steemit Crypto Academy Courses and participated in the Homework Task.
Your Homework Task verification has been done by @Stream4u, hope you have enjoyed and learned something new.
Thank You.
@stream4u
Crypto Professors : Steemit Crypto Academy
#affable
Thank you so much professor!
I hope to learn more from you next season.
Thanks for your homework, i liked it. Tell me please, where i can see the volume for sell and buy?
Hello. Thanks for reading my post.
I normally use volume to determine the strength of a trend to know if supply or demand is significantly high. A trend accompanied by higher volume is a stronger signal of confirmation than one with low volume.
I like to use the regular Volume indicator to indicate volume intensity along with the Chaikin Money Flow indicator for divergence signals. Both can be found under “fx indicators” in TradingView.
The Volume indicator gives green bars to complement bullish signals and red bars to complement bearish signals.
Notice the circled parts in the image. Notice how the red bar shoots up on the volume indicator. That shows that the supply is way more than the demand And so the bearish signal would likely hold.
I hope you understand.
Thank you so much, excellent, I understood everything. You can be a professor because you explain in clear and simple language!
Thank you 😁 I’m glad I could help.