Steemit Crypto Academy | Homework Post for @stream4u - Technical Indicator: Pivot Points
Greetings to Respected professor @stream4u and dear steemitian friends.
Let me introduce myself before starting the homework task.
I am Atul Pathak lives in state-Bihar, India. I am an agriculturist and help farmers with different planting techniques.
I am also a crypto lover and I always try to learn different trading strategies.
This was a great lecture from @stream4u about Pivot Points and I learnt using a strong indicator today which will definitely improve my trading skills.
Thanks for this amazing lecture.
Now, I am starting to write my homework.

For technically analysing the market there are many indicators available today. They all work on some principles and many calculations. Some indicator works based on-trend, some on momentum and other are volume-based indicators. If we talk about some of the strongest indicators, none of us can forget the Pivot Point indicator.
So, the Pivot Point indicator is a technical indicator that is based on trends and follows the price action in a market at different time charts. This indicator is mostly used in intraday trading.
Conceptually, Pivot Points is simply an average of the highest price of the previous day (intraday high), lowest price of the previous day (intraday low) and closing price of the previous candle. It tells about sentiments of the market. It is believed that if the market is trading above the Pivot Points it is a sign of bullish sentiments. However, if the market is trading below the Pivot Points it is a sign of bearish sentiments. Some other indicators like MACD and RSI may also be added to the trading chart by traders to confirm the positions. This indicator includes many resistance levels and the support levels which is deciding factor for a trader to enter or exit.
As our professor, @stream4u taught us that previously people used to calculate the Pivot Points using some formula, so let's see the formula on which Pivot Points can be calculated,
Pivot point = [intraday high(previous day) + intraday low(previous day) + closing price of previous day] / 3
There are some formulae used to calculate different support and resistance levels which I will not discuss here because in modern time we depend on the indicator. We just apply it on the chart and it automatically calculates the Pivot Point, Support level and resistance levels.
These Support and Resistance levels formed represent oversold and overbought zones respectively.

Main Pivot point level (PP):
This is the main level that determines the current market trend. When the price is trading above this point it is considered as a bullish signal. Below this level, it is considered a bearish market.
Support 1 (S1) It is the first level of support below the main Pivot Point. Price is expected to bounce from this level in opposite direction. Similarly, If this level is broken, it is considered as a continuation of the bearish trend.
Support 2 (S2): It is the second level of support below the main Pivot Point. Price is expected to bounce from this level in opposite direction. Similarly, If this level is broken, it is considered as a continuation of the bearish trend.
Support 3 (S3): It is the third level of support below the main Pivot Point. Price is expected to bounce from this level in opposite direction. Similarly, If this level is broken, it is considered as a continuation of the bearish trend.
Points to be remembered: All support levels act as oversold zones where buyers take a stand and try to push the market trend in opposite direction.
Resistance 1 (R1): It is the first level of resistance above the main Pivot Point. Price is expected to bounce from this level in opposite direction. Similarly, If this level is broken, it is considered as a continuation of the bullish trend.
Resistance 2 (R2): It is the second level of resistance above the main Pivot Point. Price is expected to bounce from this level in opposite direction. Similarly, If this level is broken, it is considered as a continuation of the bullish trend.
Resistance 3 (R3): It is the third level of resistance above the main Pivot Point. Price is expected to bounce from this level in opposite direction. Similarly, If this level is broken, it is considered as a continuation of the bullish trend.
Points to be remembered: All resistance levels act as overbought zones where seller take a stand and try to push the market trend in opposite direction.
Traders use the resistance level for selling their position and support level for buying their position because at the resistance level the assets start selling at a very high price and at the support level the assets start buying at a very cheap rate.
Calculating Pivot Points:
The Pivot Point is the average of the intraday high, intraday low and closing price of the previous day which means if I am trading today which is Thursday, I will be taking the value of the high, low and closing price of the candle formed on Wednesday market.
Formula used for calculation:
Pivot point = [intraday high(previous day) + intraday low(previous day) + closing price(previous day)] / 3
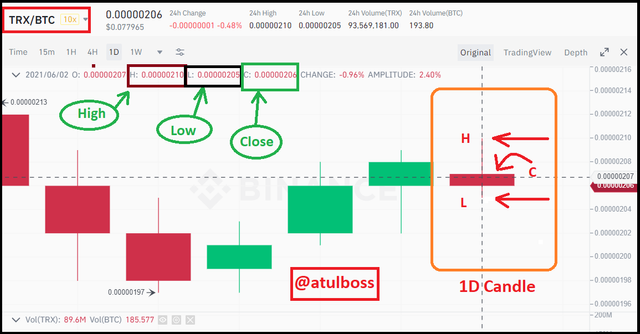
This screenshot shows that in exchanges we get the facility to get the exact high, low and close price of a particular asset by just pointing the cursor on the 1D candle.
Let us learn how to calculate the Pivot Point,
In the given screenshot, suppose that the candle closed and gave a high price equals 210, low price equals 205 and close price equals 206, then keeping those value on the formula for the Pivot Point we get,
Pivot point = [210+ 205+206] / 3 = 207
Calculation of S1 and S2
S1 = 2 × Pivot Point - Intraday high = 2x207-210 =204
S2 = Pivot Point - [Intraday high- Intraday low] = 207-[210-205] = 202
R1= 2 × Pivot Point - Intraday Low = 2x207-205 = 209
R2 = Pivot Point + (Intraday high - Intraday low) 207+(210-205)= 212
NOTE:
-A candle is not taken until closed. I have taken the example of the current candle which is going to be closed in 30 minutes of writing this article and the closing position may change. (It is just a sample picture to show the candle).
--The main pivot point should be calculated first because without knowing the main Pivot point, support and resistance level can't be calculated.
Now we will see the method to apply Pivot points,
For applying the Pivot Point indicator we need a trading chart of any asset.
Here I am taking the example of the BTC/USD pair on https://www.tradingview.com.
Now we will move step by step.
Step:1
Open a chart and search the asset in the search bar.
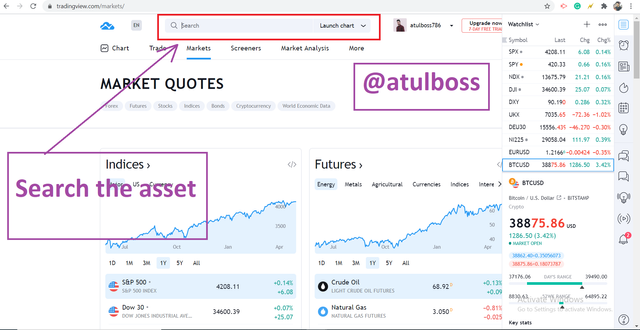
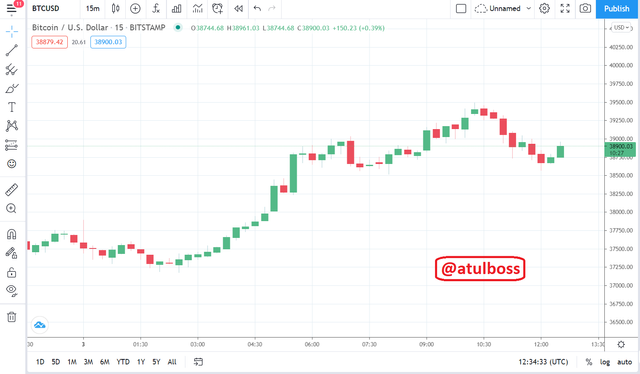
The chart will open like this. On the top of chart there are various icon which can be helpful for trading.
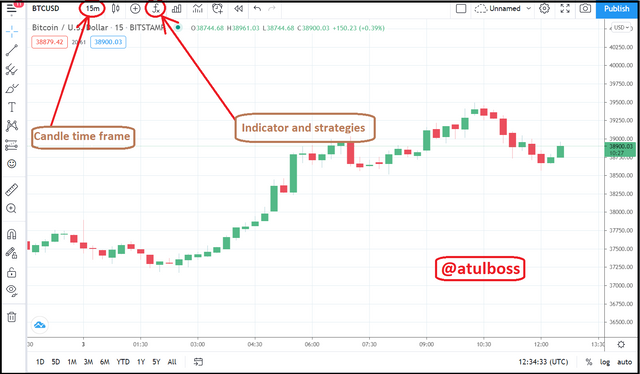
We will keep the time frame of candle to 15 minutes. It is best to use low time frame in intraday trading. 15 minutes or 30 minutes candles are preferred by most of the traders. Now, we also find Fx on the same row. This is the list of indicators and strategies
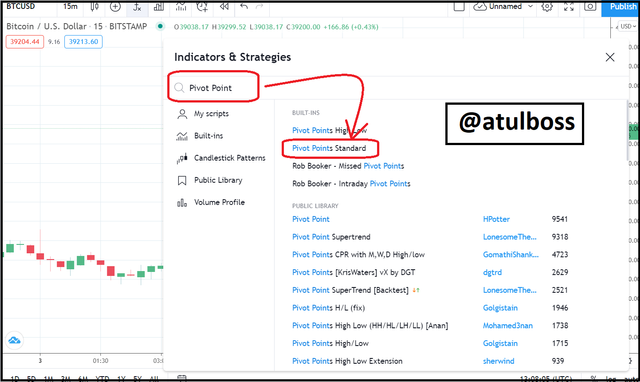
On clicking on indicators, we will get a search bar. We will directly search Pivot Points here. There are different Pivot Points in the list but we will be selecting the Pivot Point Standard.
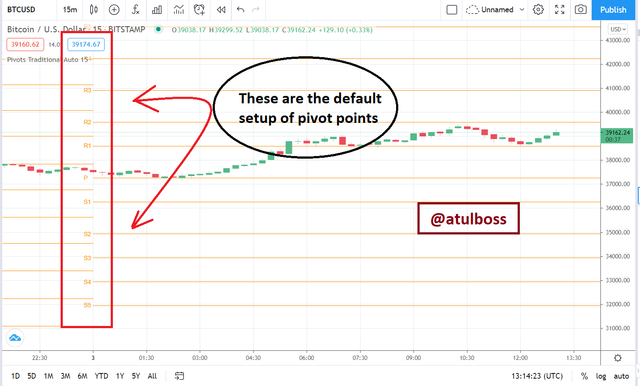
On selecting Pivot Point standard, we will now see the different support and resistance lines on the chart including the main Pivot Point shown as S1, S2, S3..., R1, R2, R3...., and P respectively.
These all are are of same colour, so it will be better to change the colour of different lines to easily differentiate while trading.
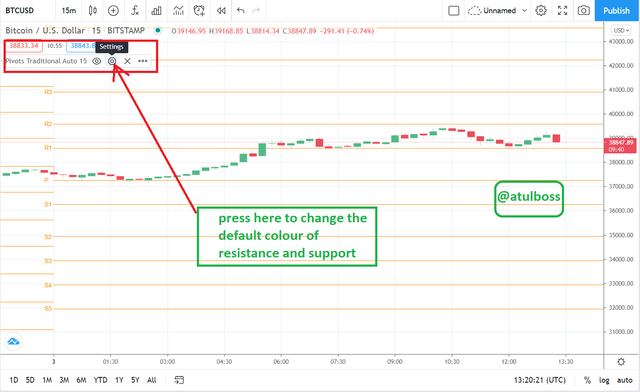
Clicking the setting icon, we will find the two options, Input and Style. To change colour, choose Style option and we will find different colour choice.
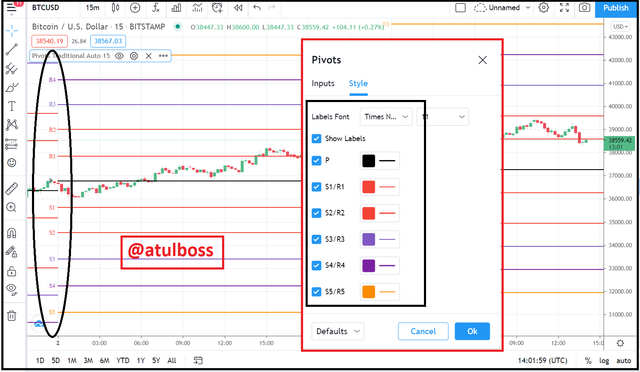 I am choosing the colour of Pivot Point as Black, S1, S2, R1 and R2 as red, S3 and R3 as blue, S4 and R4 as dark blue, and S5 and R5 as orange.
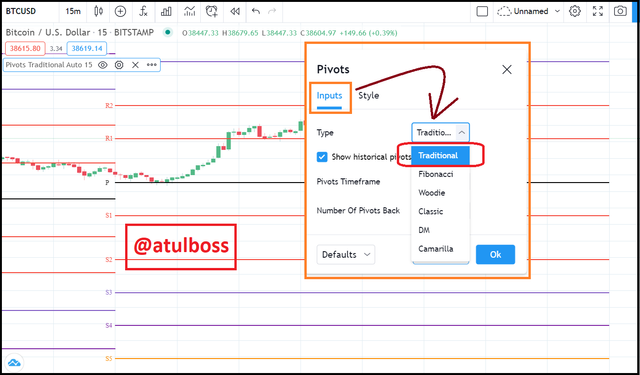 Now we come to Input, here we get a dropdown menu in which we will be choosing Traditional among Fibonacci pivot points, Woodie’s pivot point, Demark Pivot Points, and Camarilla Pivot Points. The rest of the settings will be set as default. The timeframe will be Auto, the number of Pivot will be 15.
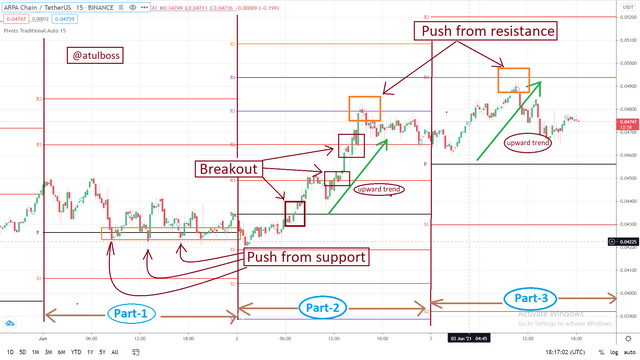
Now, we will discuss the working of Pivot Point. For this, I am taking an example of the ARPA/USDT chart in https://www.tradingview.com
The types of possibility that may occur is,
a) Push from resistance to downward
b) Push from support to upward
c) Breakout/breakeven at resistance and support.
We have already discussed that if the price is above the main Pivot Point, it is a sign of bullish sentiments however if the price is below the main Pivot Point, it is a sign of bearish sentiments.
So all the support levels always protect the market from dump because it is the area where the buyers are strong and buy the asset. This results in the possibility of a reversal in downward trend. Similarly, all the resistance level always protect the market from the pump because it is the area where the seller takes action and start selling their asset at the high price range. High selling pressure results in the reversal of the upward trend of the market.
For better understanding, I have divided the chart into 3 parts.
Let's understand,
a) Part-1:
We can see that market is moving above the Pivot Point but the trend is not much clear. Here the second type of possibility can be seen. The market is taking the support from Pivot Point and bouncing back to half of the resistance zone. Then again the market is taking support and Pivot Point is protecting the market from moving downwards. A trader is not suggested to start a trade until the trend gets clear but the risk taker can take 2-3% profit by buying at every Pivot level.
b) Part-2:
In this part, we can see that market is breaking the resistances till R3 so the market is moving in an uptrend but in R3, the sellers are strong so there is a reversal is seen and R2 is now behaving as support (there is a concept that broken resistance becomes support and vice versa). Here the third type of possibility is seen.
c) Part-3:
In this part, we can see that market is facing resistance from the seller and it is pushed from resistance. Here the first type of possibility is seen. A trader can take a decision and place a sell trade to book some profit and close the trade at the next support level.
Reverse trading is the taking position at the time of reversal of market from the resistance/support made by Pivot Point indicator. We know that there are chances of price reversal from the support in an upward direction as well as from the resistance in a downward direction.
Now let's understand this concept in BNB/USD chart opened in https://www.tradingview.com,
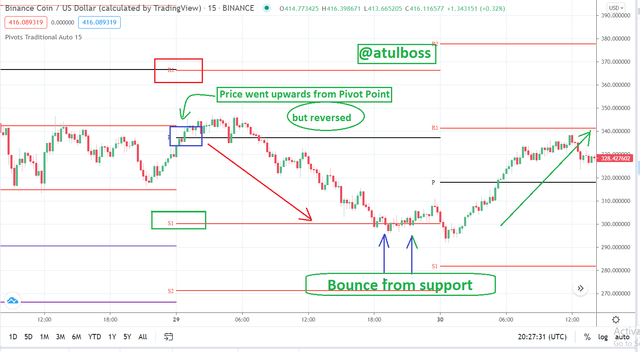
The candles are chosen in 15 minutes time frame.
The chart is showing candles of two days market trend.
We can see that on 29th May 2021, the green candle broke the Pivot lines. This is a sign of bullish sentiments and the market tend to move in an upward direction.
But after some duration market reversed and broke the Pivot Point and moved downwards. It had taken support from S1 and reversed back and again broke the Pivot Point on 30th May 2021 to resistance R1 then reversed.
Profit can be booked in each reversal of market at support and resistance because there is much possibility of reversal due to buying and selling pressure on these levels respectively but there is no 100% surety in trends so a trade must be open with a stop loss. Weak buyer and seller sometimes don't put any visual impact on charts and the levels are broken down.
- The biggest mistake in trading is to totally rely on any of the indicators. A trader should understand that none of the indicators gives a 100% correct signal. Same as the other indicators, Pivot Points also don't work in case of very bullish or bearish sentiments and the market keeps on breaking every resistance and support respectively.
- Different indicators work on different principles. They have many different calculations for different indicators. Few indicators are based on trends, others are based on volume or momentum. Pivot points are based on-trend and work on price action. It is a big mistake to keep them in the same line.
- Some traders ignore stop loss in trading. As we have discussed, in the case of presence of the weak buyers or sellers, the market may break the support and resistance levels respectively and it results in a huge loss if the decision goes wrong.
- Applying take profit at exactly the support and resistance levels may result in reversal of market without touching the take profit. This could change the profit in the loss. So traders are suggested to apply the take profit at 95% level of the S/R zones.
- Using a larger time frame in charts may lead to the wrong prediction of movement in a particular asset. It is suggested to use the very small time frame in charts because Pivot Point better works in intraday trading. 15 minutes or 30 minutes are the best time frames and it is preferred by traders.
- Using multiple indicators with Pivot Point leads to create confusion in making a decision in trading. So 1-2 indicator are enough with Pivot Points like MACD and RSI.
- Not understanding the meaning of candles may result in an unexpected loss in trading. The trader should at least well aware of different candles like a hammer, inverted hammer, hanging man etc.
- A proper trading plan must be needed before opening any trade. For this, a trader must have a very basic understanding of Pivot Point. This means a trader must know that every candle which is above pivot point is not bullish. A trader must know when to enter and when to exit. Those traders who take trading as gambling always afford the big loss.
a) Pivot Point indicator is very easy to use and can be easily understandable by new traders. It doesn't require any external setting and just after applying it starts working.
b) It is a trend-based indicator so a trader can easily understand the bullish and bearish trend and can take decision accordingly.
c) It automatically recognise the resistance and support so manually drawing is not required if we simply apply this indicator.
I am applying the Pivot Point indicator in today's chart of XRP/USD in https://www.tradingview.com
As suggested by professor @stream4u, I have taken 15 min candlestick.
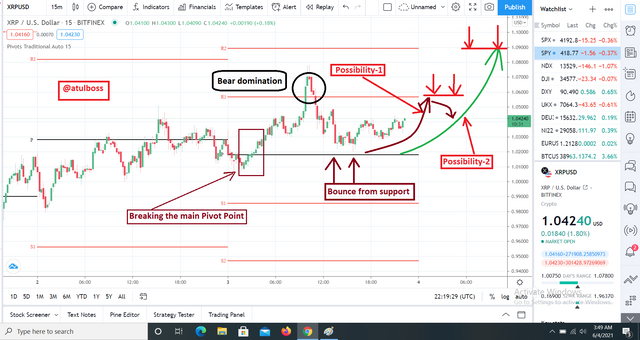
Now, as we can see in the chart, this chart has candles of 2 days market.
So, let's discuss how was the previous day.
The day started with candles forming below Pivot Point. This means the market was bearish at that time but it was continuously tried to move upward to the main Pivot Point and in the mid chart of the same day it successfully crossed the main Pivot Point. Here a trader may get the perception that now market turned bullish but as the next day started market opened with crossing downward the main Pivot Point. That means bears were dominant over bulls.
Then again market reversed and it crossed the main Pivot Point and moved towards the first resistance zones. It somehow crossed the first resistance but reversed from that level.
Now, it again fell to the main Pivot Point.
At the time I am writing the post, I can say by technically analysing it by Pivot Point indicator is that it is bullish and tend to move upward.
Now there are two possibilities which I have also shown in the graph,
- Market may go up to first resistance zone R1 and take reversal.
- Market may break the first resistance R1 and go up to the second resistance R2.
At this time, the current price of XRP/USD is 1.04240
If the first possibility became true, it will hit 1.05573
If the second possibility became true, it will hit 1.08723
Basic information of Tron
a) Tron was founded in September 2017 by a non-profit organization that is currently headed by CEO Justin Sun.
b) It uses P2P technology means its transaction requires no middle man.
c) I personally use it due to the very cheaper transaction fee and fast speed of transaction than any ethereum based cryptocurrency.
d) I use it in staking and mining and also get mining reward from it.
e) It is a very old and trusted cryptocurrency and I personally believe that it will cross $0.17 during the start of the bull run.
Why TRX???
- It comes among the top 30 ranks in https://www.coinmarketcap. When I am writing this post, Its rank is 25th.
- Its market capacity is $5.8B(approx). It is mostly a stable currency and do not sharply dump or pump. That's why people use it in transactions.
- TRX is listed in all the top exchanges like Binance, Bittrex and liquid etc.
- I am getting TRX in steemit upvotes and I am holding it for the bull run.
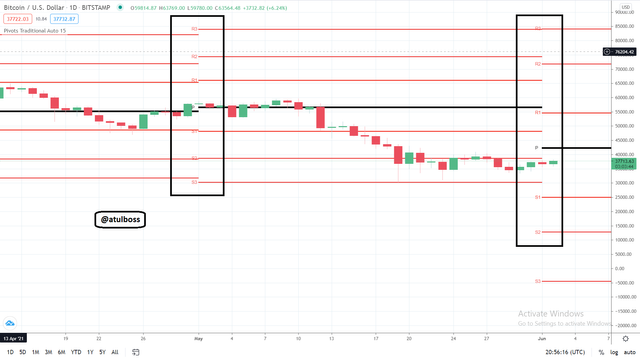
Complete technical analysis of Tron(TRX)
I have opened a chart of TRX/USD pair on https://www.tradingview.com
Also to technically analysing the market, I am using the Pivot Point indicator with MACD.
I have set the candlestick to 30 minute time so that weekly prediction can be done.
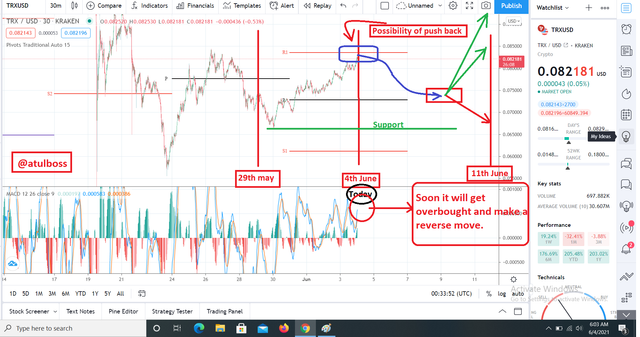
In the above screenshot, we can clearly see that the current situation of the market is predicted as bullish because the market is above Pivot points but the present candle is very near to the first resistance level. So according to the Pivot Point indicator, it will reverse the market from an upward trend to downwards.
Crossing over MACD lines in the above direction represents the possibility of going to the overbought zone, so it may cause the reversal.
The possibility is the market will come to the main Pivot Point and then there will be two possibilities, either reversal or crossing of main Pivot Point and become bearish. If the market reversed from Pivot Point, there will be again the possibility of reaching to previous resistance or breakout of resistance may happen.
According. to my perception it will cross the main Pivot Point and move downwards. Next week on 11th June, we will see that it would stop at the small support level I have drawn additionally.
According to my perception,
A possible Low level in the next week may be $0.066419
A possible High level in the next week may be $0.083607
I got a very deep knowledge of the Pivot Point indicator. Here I learnt many things which may improve my trading skills. The best part of the whole topic was I have applied it to a chart of a crypto asset and forecasted its price. I am very excited about watching the TRX price in a week to check the validity of my prediction.
I would like to use this indicator further in trading.
Pivot Points are basic indicators mainy used for intraday trading.
It follow support and resistance and based on trend of market.
I learnt about big mistakes which usually traders do in lack of knowledge.
I also got to know that this indicator may help in good profit making if applied with stop loss but totally relying on any indicator may lead to loss of capital so it is necessary to DYOR.

Hi @atulboss
Thank you for joining The Steemit Crypto Academy Courses and participated in the Homework Task.
Your Homework Task verification has been done by @Stream4u, hope you have enjoyed and learned something new.
Thank You.
@stream4u
Crypto Professors : Steemit Crypto Academy
#affable
Thank you dear professor @stream4u for reviewing my post. :)
Hi @atulboss,
Which State/UT do you belong to?
We need this data for geo-mapping of active users & for spatial analysis.
Thank you.
Greetings @sapwood
I belong to Bihar State in India.
Thank you.
You have been upvoted by @sapwood, a Country Representative from INDIA. We are voting with the Steemit Community Curator @steemcurator07 account to support the newcomers coming into Steemit.
Engagement is essential to foster a sense of community. Therefore we would request our members to visit each other's post and make insightful comments.
Thank you.
Thanks for up vote :)