Homework Post for Professor @yousafharoonkhan - Topic :How to create an account on TradingView, how to use indicators,tools, features of tradingview By @atim1234 - Crypto Academy / Season 3 / Week 7
Assalamualaikum, Professor @yousafharoonkhan , I have read and leaned the assignment you gave entitled How to create an account on TradingView, how to use indicators, tools, features of tradingview, I think this task is very interesting and very useful.
This time I try to finish the homework you gave with a few questions

Question no 1:
Defining the TradingView site and how to register an account in tradingview? what are the different registration plan?(screenshot necessary)
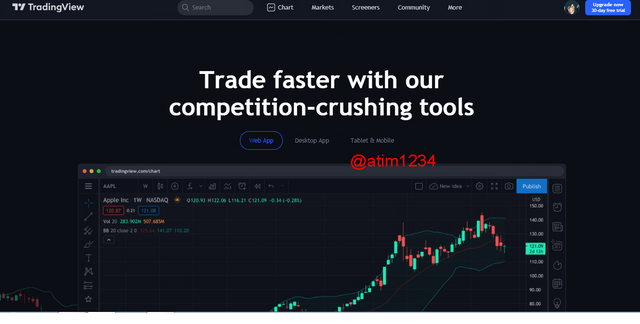
TradingView is a social trading tool that can display detailed price charts for a variety of marketplaces. As a result, many traders utilize this instrument as a community to discuss ideas with one another. TradingView may also be used to do technical analysis on a variety of asset types.
This platform's primary goal is to give insight as well as real-time information on financial markets. This website enables traders from all around the world to establish accounts, examine charts and numerous technical indicators, build trading setups, and submit trading ideas for community discussions.
This platform is also available on the App Store and Google Play, making it more accessible to traders.
Register an account in tradingview.
- The first thing you have to do is open the tradingview.com site
- On the top Right Side menu click the Profile icon and Click Sign In.
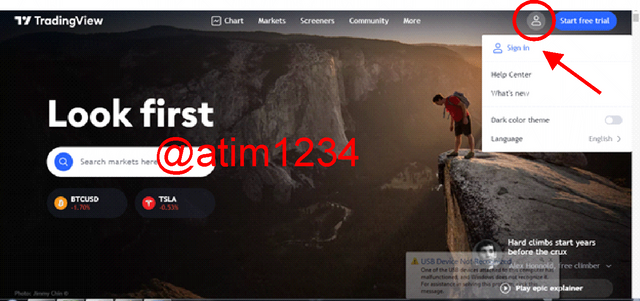
- If you already have an account, you can sign in using Google, Facebook, Twitter, yahoo, Apple Id or using Linked In and because you don't have an account, scroll to that page and click Sign Up.
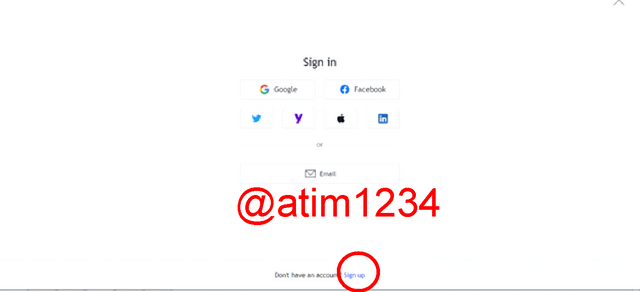
Here I register using a Google Account, because in my opinion registration through a Google account is an easy way, we only need to connect our Google account to the tradingview site.
After Successfully Connecting the Account, here we will create our profile on the TradingView site.
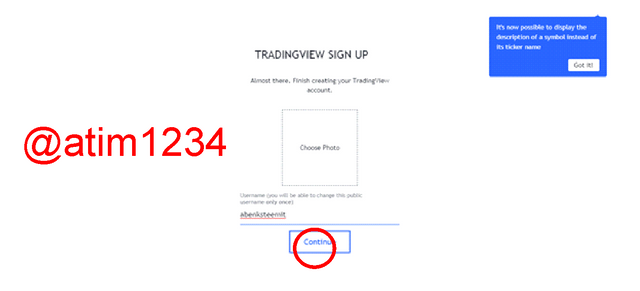
Upload your profile photo, and provide your username, then click Continue.
And your account has been successfully registered on the tradingview site.
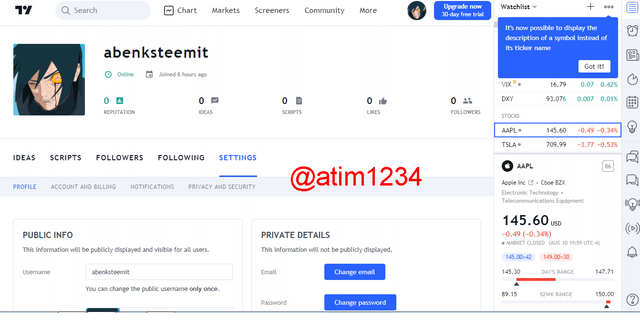
But this is the free version of the basic account that you have, whose name is a free account, of course there are limitations when using the tools available in tradingview. Tradingview has a Paid Package with many excellent features, and you can try this package for free for the next 30 days.
The packages available here, namely the Pro, Pro + and Premium packages, of course, these packages have varying prices and also with different features, and the method of subscribing to this package is monthly and annually.
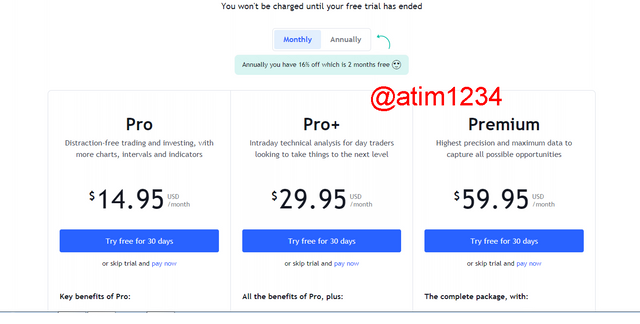
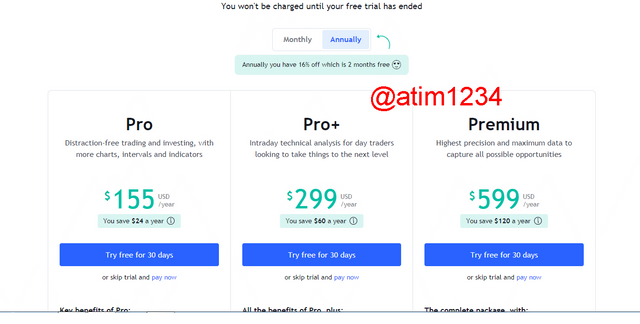
With the price details as follows:
| Paid Plan | Pro | Pro+ | Premium |
|---|---|---|---|
| Monthly | $14.95 USD | $29.95 USD | $59.95 USD |
| Annualy | $155 USD | $299 USD | $599 USD |
Of course they not only make packages with different prices, but there are features that are added and subtracted from each package. and these are the features provided according to the package price
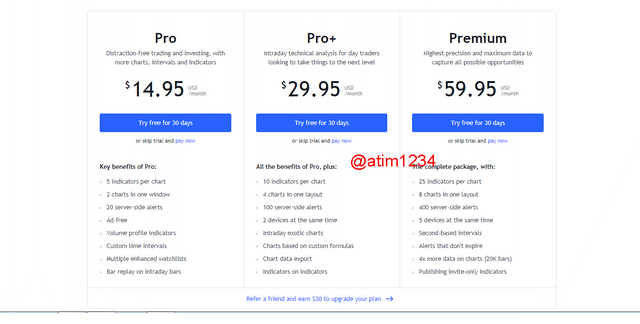
If you select the Pro Package, you will receive benefits, 5 indicators per chart, two charts in one window, and 20 server-side alerts Ad-free, Indicators of volume profile Customizable time intervals, Several improved watchlists, On intraday bars, there is a bar replay.
In addition, the Pro+ subscription includes features such as 10 indicators per chart, 4 charts in one layout, 100 server-side alerts, and the ability to use two devices at the same time. Exotic intraday charts, Custom formula-based charts, Data export from charts, indicators on indicators
And the last is the premium package, this is the highest package on this site, maybe this package will provide more benefits for users, although it is a bit expensive, but the price is very worth the features provided in the form of 25 indicators per chart, 8 charts in one layout, 400 server-side alerts, 5 devices at the same time, Second-based intervals, Alerts that don't expire, 4x more data on charts (20K bars), and Publishing invite-only indicators.
Question no 2:
Explain the different features of tradingView and what is your favorite feature and why?(screenshot necessary)
According to the site itself https://tradingview.com/features/ there are very many features currently provided by this platform, and of course it can help us in studying market prices and technically analyzing some of the tradingview features that I have summarized.
Chart View
TradingView features a visually appealing chart presentation. It has comprehensive indicators, news update support, alarm reminders for each user, and access to multiple price charts of various asset classes.
There are many versions of charts for the same instrument, so users are not forced to use charts from one broker, giving them additional options.
TradingView, on the other hand, can provide a social trading platform that connects directly to price analysis charts. So that Users will find it easier to assess and exchange trading ideas with other TradingView users.
Lots of Trading Ideas
This feature collects and shows hundreds of trading ideas from the Community, as well as anybody who participates in social trading conversations with other members or the trading idea's owner.
Furthermore, TradingView categorizes trading ideas based on asset type, trend analysis, harmonic patterns, technical indicators, Wave analysis, Gann, and other analytical methodologies.
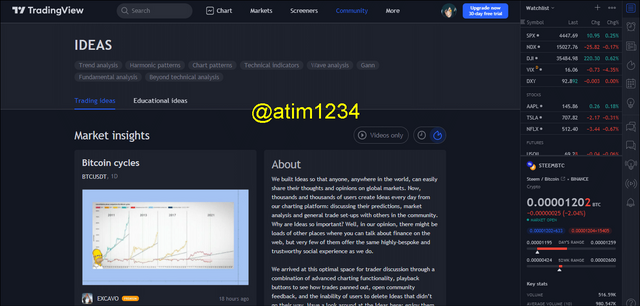
Trend analysis is further subdivided into Support and Resistance, Supply and Demands, Pivot Points, Fibonacci, Trend Lines, Candlestick Analysis, Fractals, and many others.
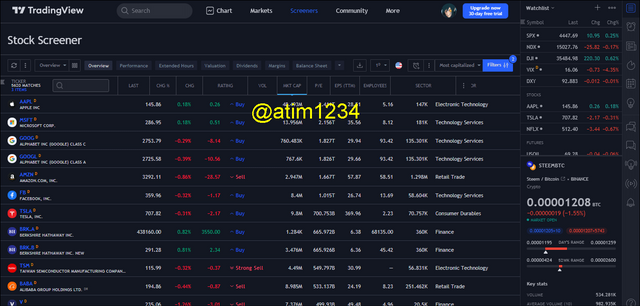
Market Scanner
Tradingview's Market Screener function may be used as an analytical tool for a variety of trading instruments such as Forex, Stocks, Stock Indices, Futures, Bonds, CFDs, and Cryptocurrencies.
My Favorite Featur.
My favorite feature from trading view is the community, because here I can learn and get trading ideas from the best traders and investors from all over the world.
Question no 3:
How to set up a chart in TradingView and use two tools to edit it.(screenshot necessary)
After knowing the Definition of Tradingview, How to register, and Paid Plain in the trading view, and we also understand the features in TradingView, it's time for us to know How to set the Chart.
- The first time, you have to go to the Chart page in the menu bar.
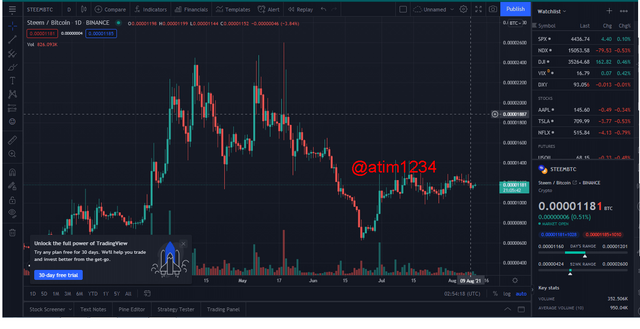
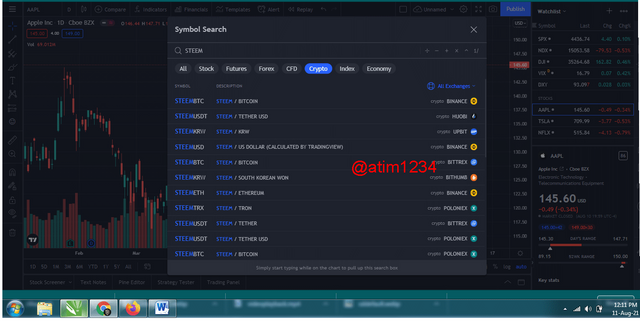
- After the Chart Page opens, choose the market you want to set, Here I will set the STEEM/BTC Chart
- On the Symbol Search menu, search for STEEM/BTC
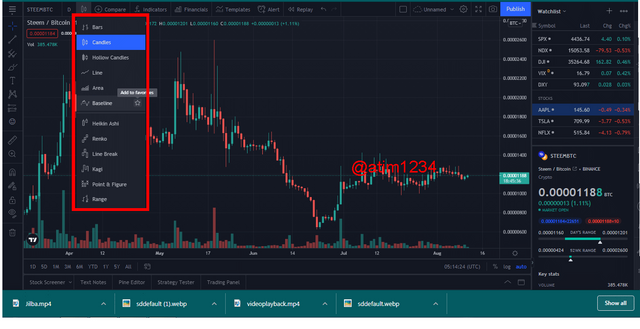
- We can change the type of Chart that we will use,
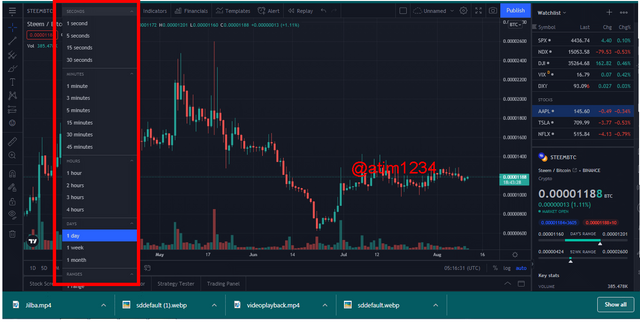
- Set the Chart Time frame you want
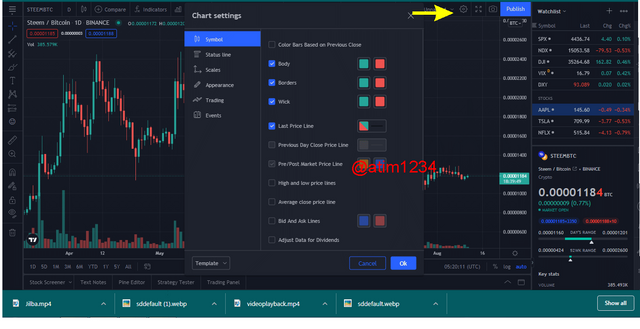
- And on the Gear Icon on the chart, you can add some customizations starting from the Color bar, Chart Color, Status Line, Appearance, and several other customizations like a in the image below.
Tool to Edit.
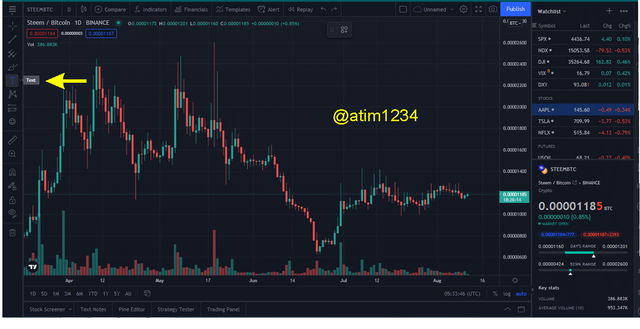
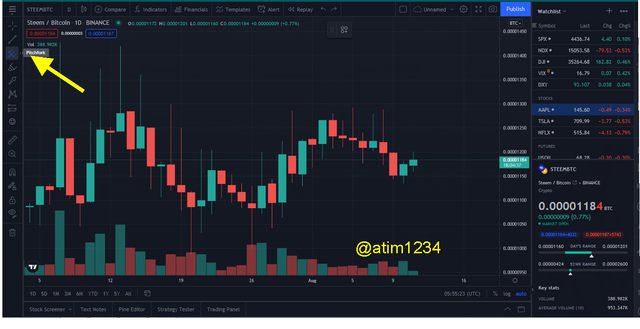
For the tool I use to edit the chart, I use the Arrow Marker. We can use Arrow Marker to mark the price of a bullish or bearish market.
- First, on the Side menu, click the Text icon
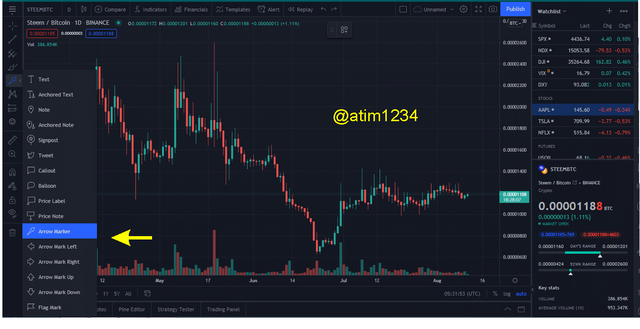
Scroll Down And Click Arrow Marker
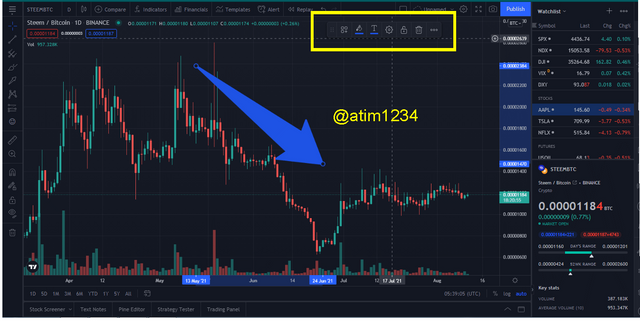
look for, the market trend that is bearish or bullish and then describe it, by clicking on the beginning of the Bearish or Bullish point to the top of the market price.
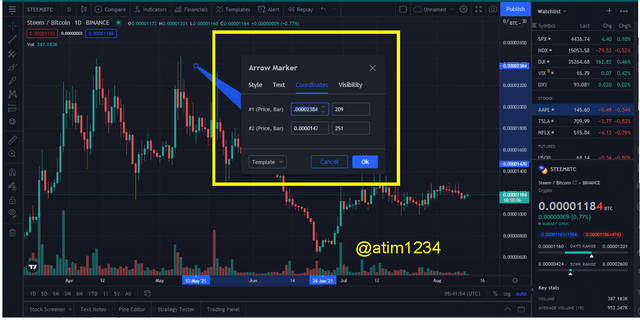
- And we can still adjust some changes from the arrow that we have drawn, starting from the color, text, coordinates, and visibility.
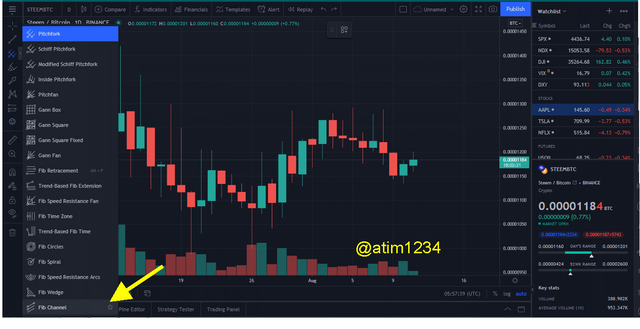
And the second tool that I use is the Fibonacci Channel tool, Fibonacci Channel, is a tool used to estimate support and resistance levels based on numbers generated from Fibonacci.
- On the left menu, click Pitchfork
- Then , Scroll Down and select the Fibonacci Channel.
- Draw this Fibonacci Channel by clicking on the low coordinate to the low point which is higher than the previous point. here I make an X for the lowest point and Y at the higher point. And move the channel one more hight which is a bit close to the X and Y points. and I mark this point with the letter Z
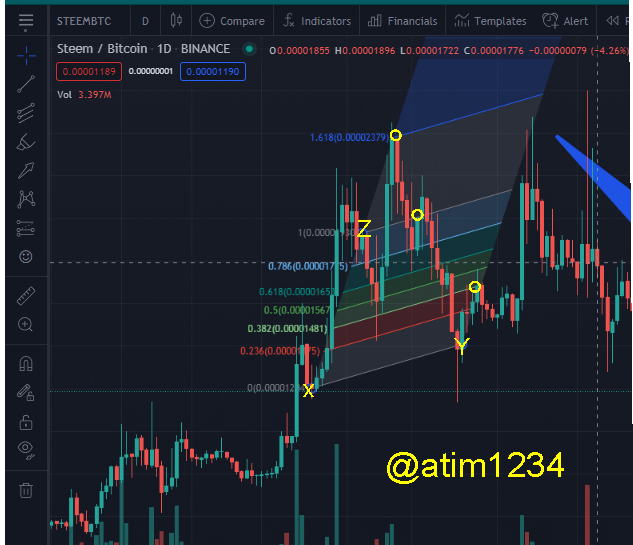
- And formed, the Fibonacci Channel and automatically these lines will become support and resistance. So that we can estimate when the rebound will be when the price will be stuck like at the points I circled.
Question no 4:
Explain how to add indicator in chart, what is your your favorite indicator and why? (screenshot necessary)
How to add Indicators to charts in TradingView It's very easy, you just need to click on this tool.
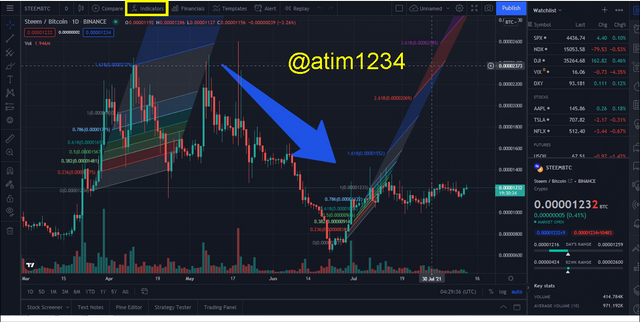
Then there will be many choices of indicators that you can choose, there are even indicators that have been made by traders in this community. This time I will add the Doji indicator,
Select Candlestick Pattern, Then Click Doji
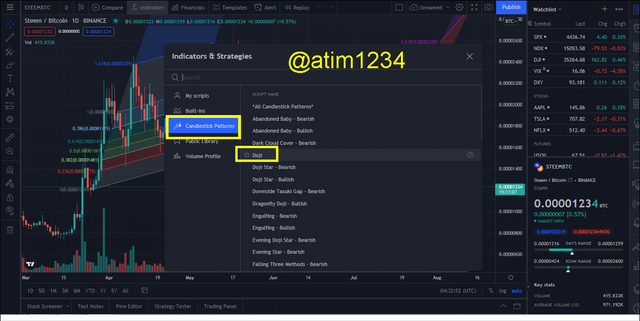
The doji indicator is one of the indicators to identify the doji candle on the chart. Although simple, this indicator is very responsive to price changes and can send early warning signals.
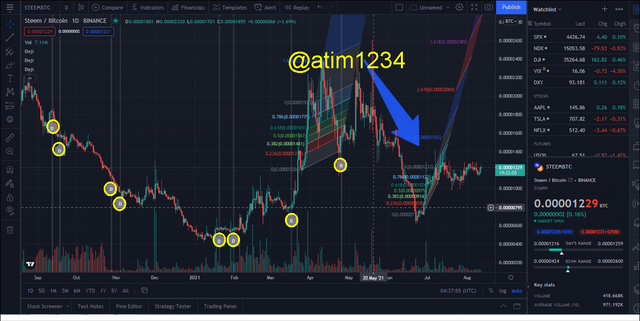
Like the picture above where the doji indicator has been formed automatically
I really like this doji indicator, and it's my favorite indicator. because in my opinion Doji is a sign of a consolidating market and has not yet determined whether the market will move bearish or bullish. Now to take action, as a trader we have to read the previous candle after the Doji is formed
Question no 5:
Do you think TradingView is useful in predicting the market for cryptocurrency (trend / price)?
Yes, I really think that TradingView is very helpful for us in analyzing prices and TradingView's tools are undoubtedly superior. Of the various interesting features provided, of course, provide benefits that can be used by traders.
Not only crypto assets that we can analyze, but also stock assets, forex and other market commodities. and of course very sophisticated, beoumm again coupled with the existence of a very extraordinary community
Conclution
TradingView is a highly recommended platform for traders and investors. Because the tools in TradingView are very helpful for beginners, intermediate, and experienced traders from all over the world.
Although There are some limited tools because we have to move to a paid plan, but we can try the free trial plan for 30 Days.
The strong community that tradingview has is a very good community, and also provides support for novice traders, especially if we become premium members of course we will be a priority. and also we can interact with millions of traders around the world.
Regard by @atim1234
CC To My professor
@yousafharoonkhan
@yohan2on

Respected first thank you very much for taking interest in SteemitCryptoAcademy
Season 3 | intermediate course class week 7
Alhamdulillah, thank you prof @yosafharoonkhan