Trading STEEM with Fractals and Multi-Timeframe Strategies
This is my homework post for Steemit Crypto Academy’s assignment on Steemit Engagement Challenge Season 20 Week 3, Trading STEEM with Fractals and Multi-Timeframe Strategies.
Note :
- I am not a professional trader. What I have written in this article is theoretical, based on various sources I have read on the internet. By participating in assignments at Steemit Crypto Academy, I feel that I have gained a lot of theoretical knowledge in understanding the asset market (especially crypto) and also topics related to blockchain. Thank you for this opportunity.
- I performed this task on Windows 10 PC, Google Chrome.
Brief Notes of Market Fractals
Before we move further, here is a little note about Market Fractals.
Market Fractals is one of the key concepts developed by a man named Bill M. Williams, and it is a technical analysis tool in the trading world. Interestingly, Williams was a psychologist who later turned his attention to the financial markets and gained popularity in the world of trading theory. Williams saw that markets tend to be viewed as chaotic and disorganized, therefore traders can be successful in trading if they are able to understand the basic structure of the market. Based on this premise, Williams has worked to develop a series of indicators that are meant to help traders understand the hidden patterns in the irregularities of the market that can be exploited to gain success in trading.

The fractal concept is actually younger when compared to some other well-known technical analysis concepts, such as Dow Theory (developed by Charles H. Dow in the late 19th century), Elliott Wave Theory (developed by Ralph Nelson Elliott in the 1930s) and Relative Strength Index (RSI) (developed by J. Welles Wilder and introduced in 1978). The concept of Market fractals was introduced in 1995 when Williams published his book Trading Chaos which soon became one of the popular trading books to date. One of the main theories in the book is that financial markets are fractal like natural phenomena, where larger price patterns can be broken down into smaller patterns, which essentially resemble the original pattern.
Task 1 - Explain Market Fractals Explain what market fractals are and how they can be used to identify trend reversals. Provide an example of a bullish and bearish fractal using a STEEM/USDT trading pair.
What Market Fractals Are
The fractal concept in Williams' book was influenced by math’s chaos theory, which studies dynamic systems that appear disordered but are actually governed by deeper repeating patterns. That's how the famous book got its title. Fractal theory is useful for spotting reversal signals or pivot points. According to Williams, traders can use these patterns to make better trading decisions if they are able to recognize fractals on various time scales.
In technical analysis in the trading world, Market Fractals is a concept used to denote repetitive patterns of price movements on various time scales in financial markets. A fractal is essentially a structure made up of smaller patterns similar to the overall structure itself. The theory may be slightly similar to the Impulsive Waves theory we learned about last week, but Market Fractals tend to take a more “in-depth” look at market volatility. What they have in common is that they both 1) describe recurring market structures (price patterns); 2) are related to trends; 3) can be used on a variety of time scales, and 4) are used to identify trend changes. While their differences are: 1) Impulses are large movements, while Fractals are small patterns; 2) Fractals indicate a change in trend, while Impulses are part of the trend; 3) Impulses are stronger and faster than Fractals, 4) They have different contexts of use especially in the variation of supporting technical analysis tools, if Fractals are generally juxtaposed with Alligator, then Impulses are usually associated with Elliott Waves Theory.
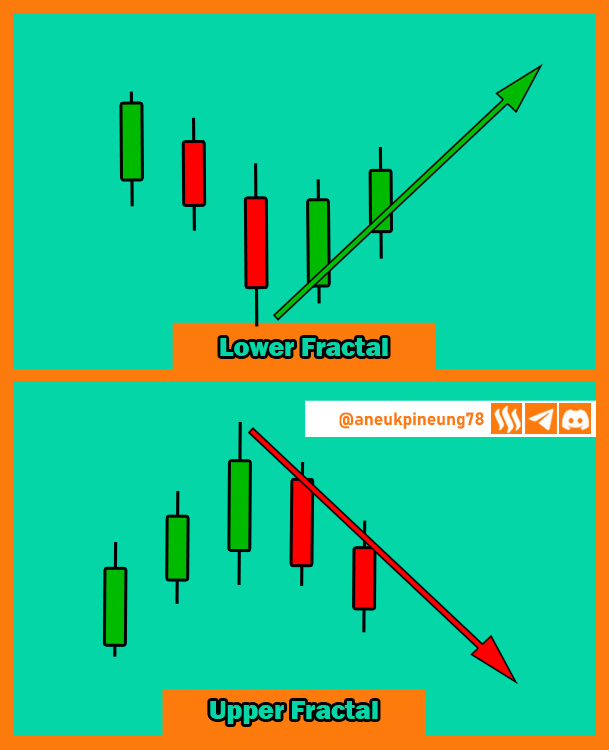
Simply put, Market Fractals are small price movement patterns that repeat themselves. Fractals consist of five candlestick bars and are used to identify market reversal points. A fractal consists of 1 candlestick that becomes a peak or valley flanked by two candlesticks on the left and two on the right. So, a Fractal can look like the letter V (Lower Fractal) or the letter V inverted (Upper Fractal).
Upper Fractals (also called Bearish Fractals) signal a potential trend change towards bearish. Conversely, Bottom Fractals (or Bullish Fractals) indicate a potential trend change towards bullishness.
How Market Fractals Can Be Used to Identify Trend Reversals
When the market is in a certain trend, pay attention to the repetition of fractals. For example, in a bullish trend, as long as the lower fractal that arises is higher than the previous upper fractal, the bullish trend will continue, until a valid upper fractal is created that will bring a trend reversal. The same law applies to bearish trends, where the upper fractal formed is always lower than the previous upper fractal then the bearish trend will continue, until a valid lower fractal is formed.
Example of A Bullish and Bearish Fractal Using a STEEM/USDT Trading Pair
Bullish Fractal Example
Let's look at an example of a Bullish Fractal reversing the trend from bearish to bullish on the STEEMUSDT historical price chart that occurred on September 16, 2024 on a 15-minute trade on the Binance Spot Market as seen on the TradingView below.
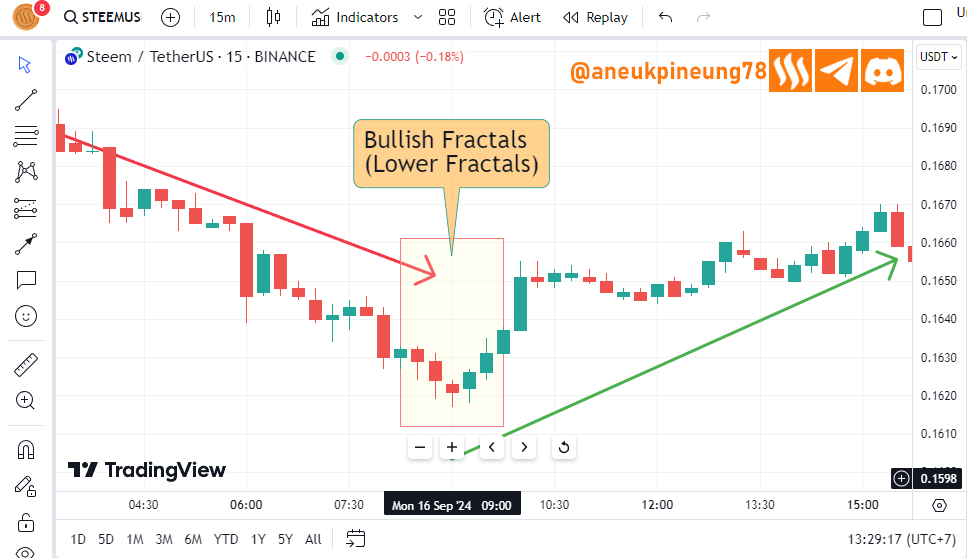
The screenshot shows that after a long downtrend with the upper fractal formed always lower than the previous upper fractal, until at 09:00 UTC+7 a solid lower fractal was formed which has turned the trend into a bull.
Bearish Fractal Example
For an example of a bearish fractal, let's look at the following screenshot which records the STEEMUSDT historical price chart on September 10 to 11, 2024 when there was a long bullish trend with the lower fractal arising always higher than the previous upper fractal, and on September 11, 2024 at 01:30 UTC+7 a valid and solid upper fractal appeared which changed the trend to bearish.
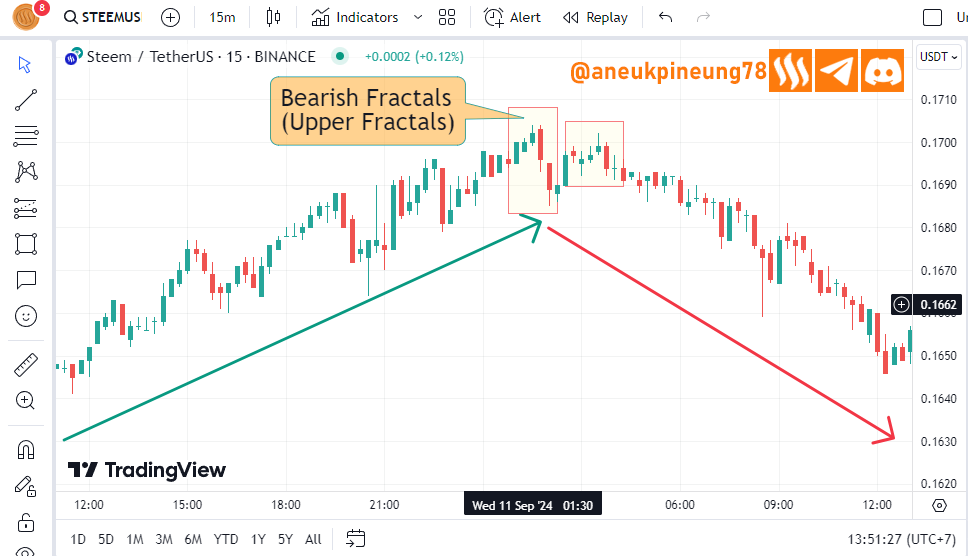
In the screenshot, it can be seen that there was a slight residual attempt by the market to restore the bullish trend, but it was unable to form a new higher high, so the bearish trend became absolute.
Task 2 - Combine Fractals with Other Indicators Discuss how fractals can be combined with other technical indicators like the RSI, moving averages, or Alligator to improve trend predictions. Show a practical example of using these tools together on a Steem chart.
Combining several indicators is of course a highly recommended way to go, because the more indicators used, the conclusions that can be drawn from what is seen on the price chart will be closer to the truth. The more cross-indicator confirmation, the more reliable the conclusions made and the more accountable the actions taken. We will look at the STEEMUSDT price history on September 14 when the Lower Fractal (Bullish Fractal) formed, and combine it with 3 other indicators and see how the Fractal and other indicators confirm each other.
- RSI (Relative Strength Index)
RSI is a momentum indicator by which traders gauge whether an asset is overbought or oversold. Standardly, oversold and overbought levels are 30 and 70 respectively. If the RSI line is below the oversold number (30) then it's a signal that the market is about to reverse towards a bullish trend, and if the RSI line is above the 70 level (overbought number) then it's an indication of an imminent bearish trend reversal.
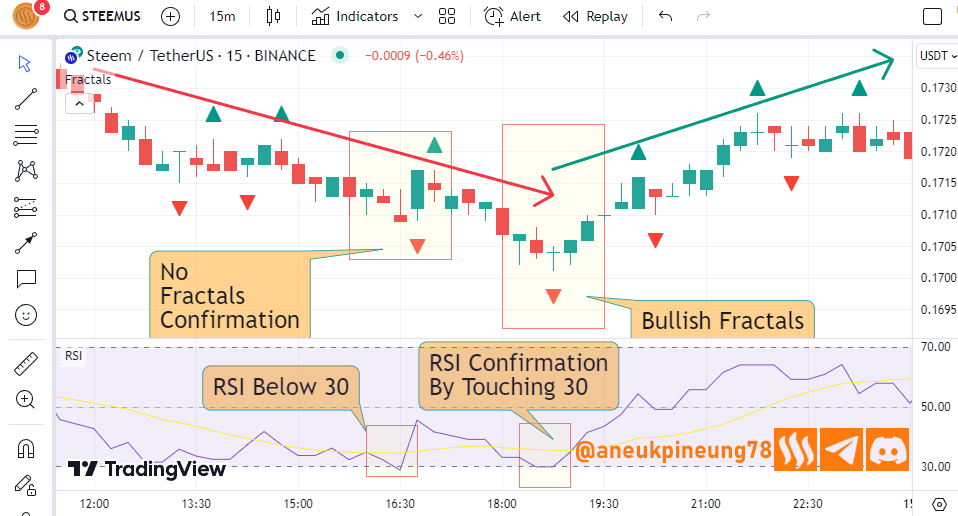
In a bearish situation, when a solid lower fractal appears, the RSI confirmation that a bullish trend reversal is imminent is for the RSI line to be below 30. Let’s look at this picture below.
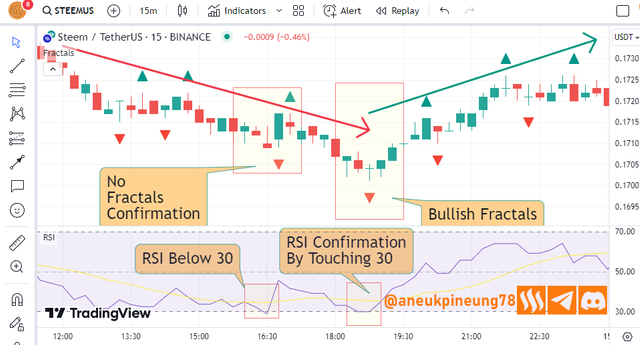
In the picture, it can be seen that on September 14, 2024 at 16:30 UTC+7 the RSI briefly moved below the 30 level but there was no confirmation from the Fractal, so there was no trend reversal. Then at 18:45 UTC+7 a Bullish Fractal was formed and the RSI crossed the oversold line, confirming a trend reversal, the rest is history. - SMA 9 (Simple Moving Average 9)
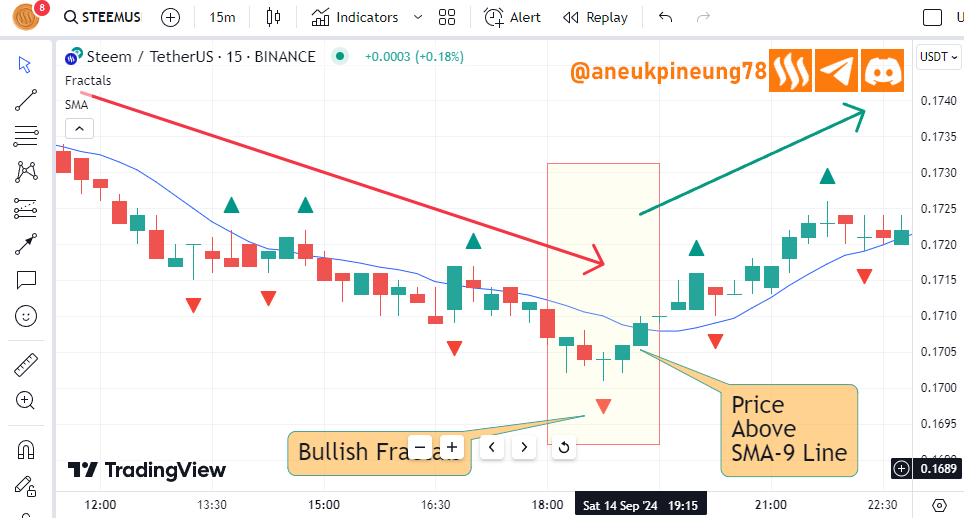
The basic concept of Moving Average (MA) is to smooth out price movements and make it easier to identify trends. There are many variants of MA, among which the two most famous are Simple MA and Exponential MA. Here I used the SMA with a period of 9. The result is shown in the following image.

In the image above, it can be seen that after the Lower Fractal formed at 18:45, 30 minutes later (19:15), SMA 9 confirmed the trend change to bullish by showing the price was above the SMA line. So, in this case it took two bars (candlesticks) to get confirmation of the trend change. It was worth the wait. - Alligator
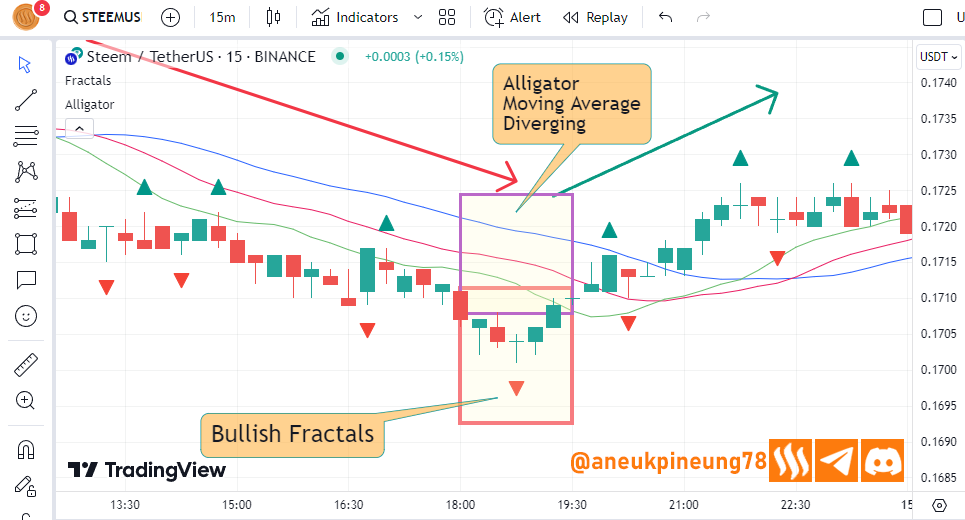
Interestingly, the Alligator, like the Market Fractals, is an indicator also developed by Williams. The Alligator has 3 Moving Averages which are respectively named jaw, teeth, and lips. The tidbit that the Alligator rumors is when it “opens its mouth” (moving averages diverging), when the alligator opens its mouth upside down, it is a red flag. Take a look at the following picture.
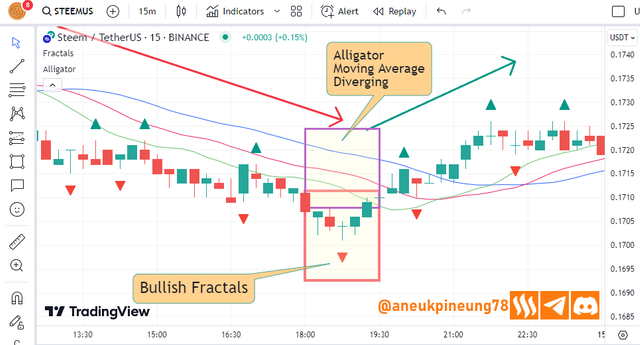
In the image above, it can be seen that when the Lower Fractal occurs, the Alligator is still in a state of forwarding its signal, namely Moving Average Diverging, so it can be concluded that the market is cleaning up and preparing for a change in trend.
Task 3 - Using Fractals Across Multiple Time Frames Show how fractals can be used on different time frames (daily, weekly, or even hourly charts). Identify fractals on a daily and weekly Steem chart and explain how they interact to provide a comprehensive market outlook.
Using Fractal on Different Timeframes
Fractals can be used on various timeframes, from small timeframes (1 minute) to large timeframes (monthly).
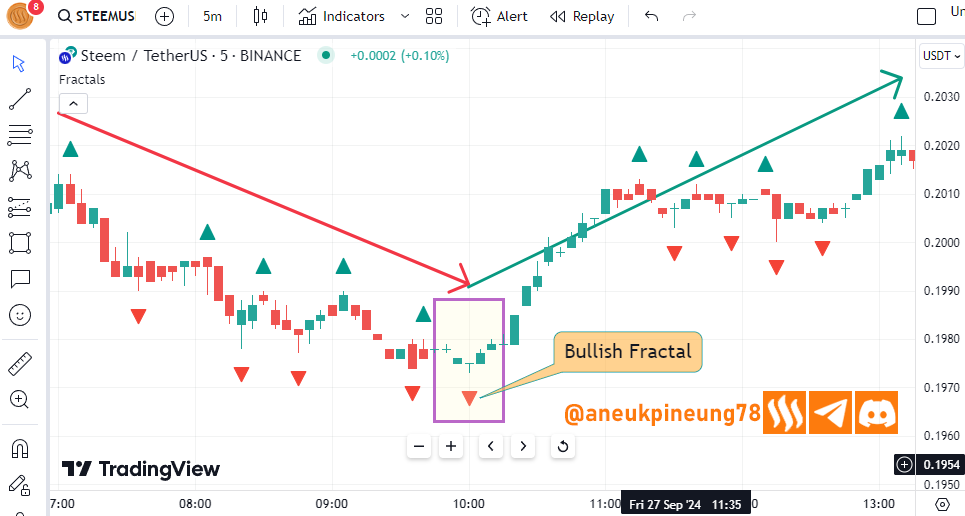
- Used on small timeframes (1 minute to 15 minutes), Fractals can help traders scalp. But high volatility causes many signals generated by Fractal and not a few false signals also appear. It is necessary to use other indicators to help “clean” the signals. Check out the following screenshot, char the historical price of STEEMUSDT 5-minute trades on the Binance Spot market as seen on TradingView.
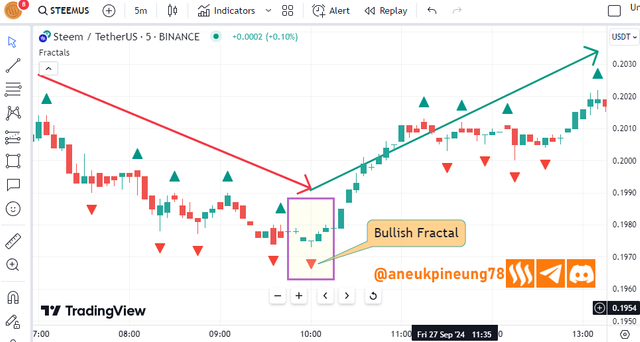
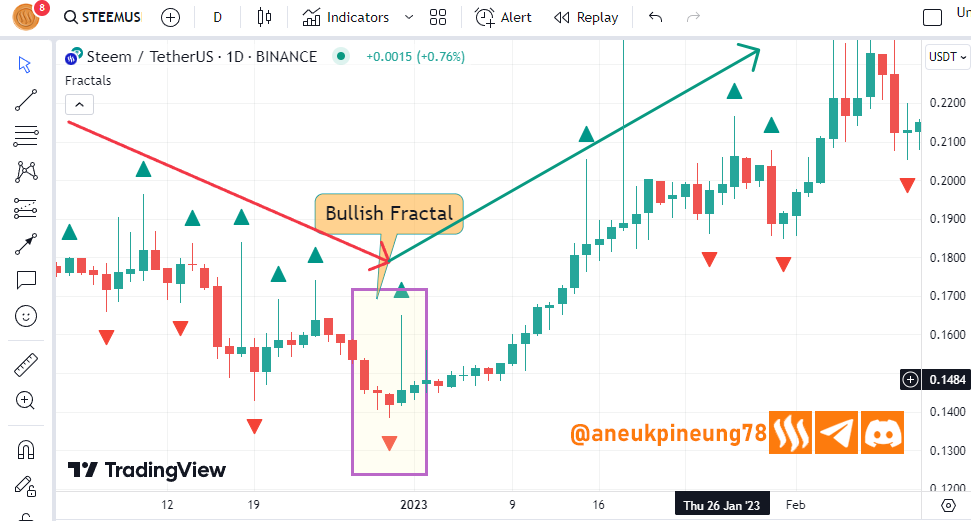
Fractal on 5-minute STEEMUSDT trade historical price charge. - On medium timeframes (4-hour, daily), Fractals can be used by swing traders who want to catch medium-term price reversals. This is suitable for trades that are a few days to a week apart. The image below shows a Fractal on the 1D timeframe of the STEEMUSDT historical price chart on TradingView.
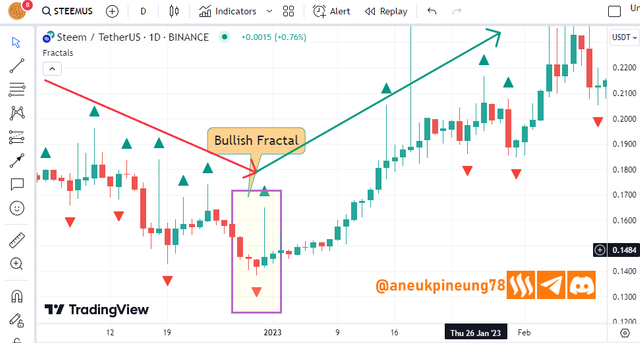
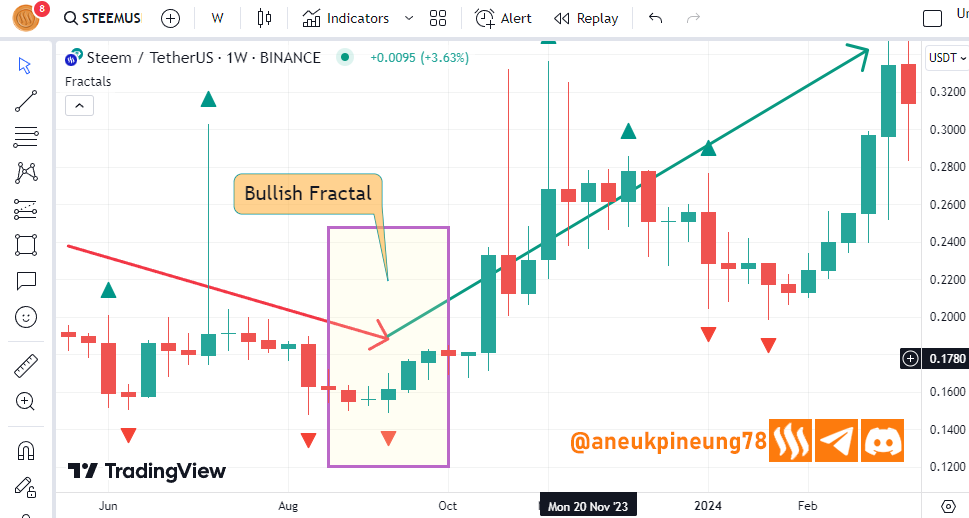
Fractral on 1-D timeframe of STEEMUSDT - On large timeframes (weekly and monthly), Fractals can help traders plan positions for their long-term investments. Below is a screenshot of Fractal on the 1-week timeframe of STEEMUSDT historical price chart.
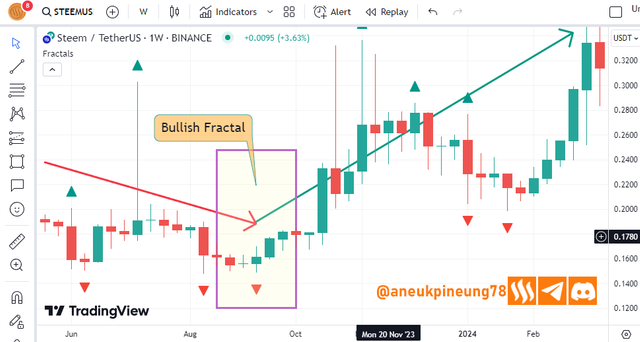
Fractral on 1-W timeframe of STEEMUSDT
Identifying Fractals On A Daily And Weekly STEEM Chart and How They Interact
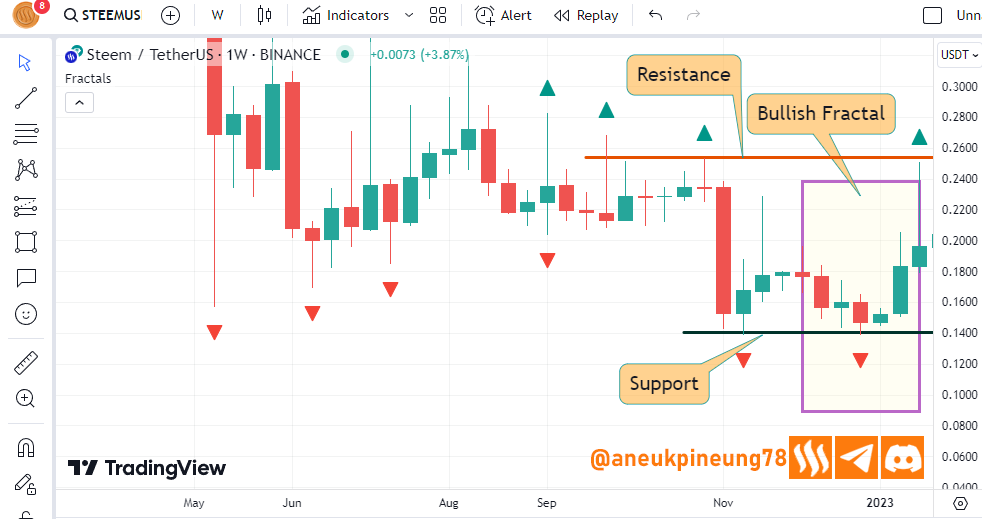
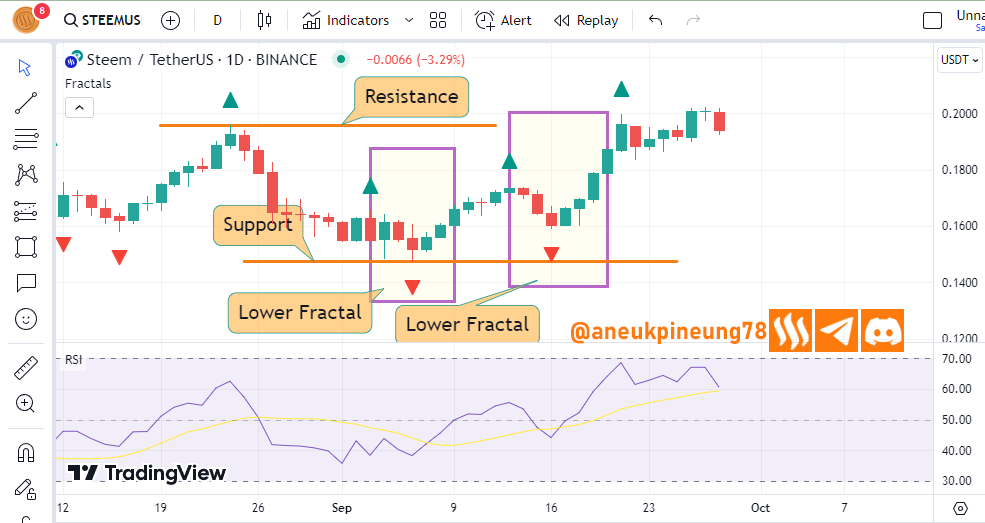
This kind of multiple timeframe analysis strategy helps to understand market conditions more thoroughly. The interaction of multiple timeframes helps to find the dominant trend which also helps to spot better entry or exit opportunities. To carry out this strategy, start observing on larger timeframes. For example, in analyzing with daily and weekly timeframes, then start with the weekly timeframe. The goal is to see the big trend on the weekly timeframe. The upper fractal and lower fractal on the weekly timeframe can be used as resistance and support levels when making decisions on the daily timeframe. After that, go down to the daily timeframe to determine more precise entry points based on information from the weekly timeframe.
Let’s start observing STEEMUSDT chart on a weekly timeframe.
Then let’s move to the daily timeframe, this is what we have:
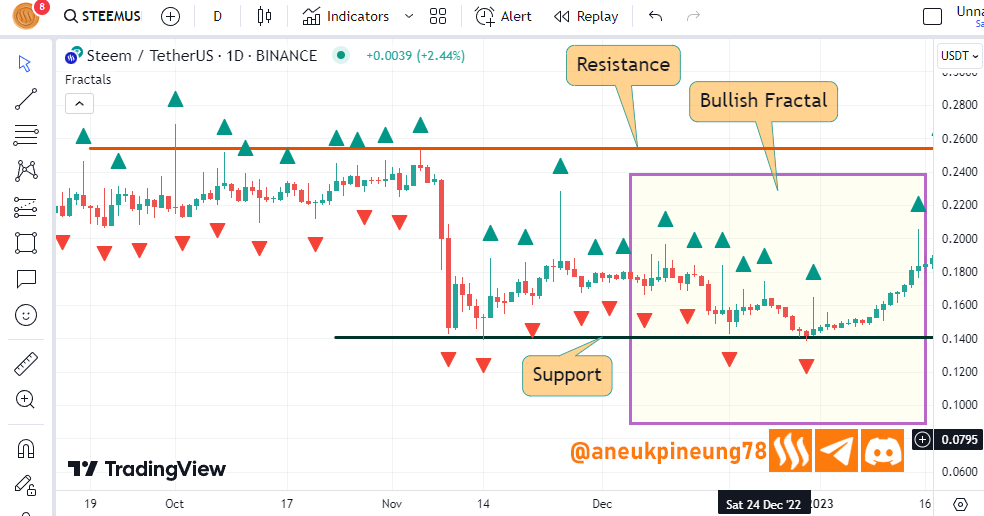
The screenshot above proves that we can miss a bullish signal from a fractal if we only rely on analyzing the chart on a specific timeframe (in this example a daily chart) and ignore observations on the chart with a larger timeframe (in this example weekly).
History has recorded that the next price movement is as shown in the following bar.
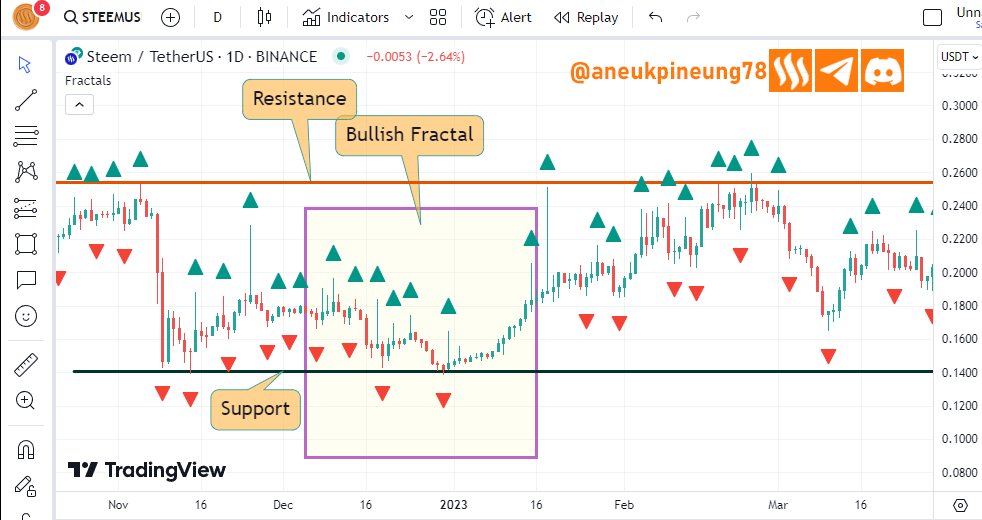
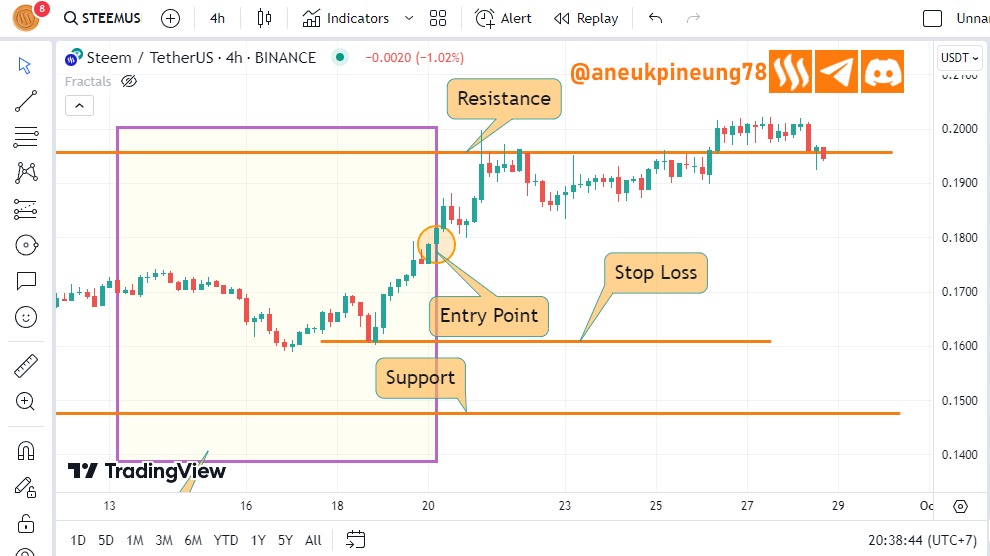
Through the screenshot above, we understand that the support and resistance levels suggested by the larger timeframe (in this case weekly) are quite feasible when positioning using the smaller timeframe (in this case daily).
Task 4 - Develop a Trading Strategy Based on Fractals Create a complete trading strategy using fractals for the Steem token. Specify entry and exit points, stop-loss levels, and use recent fractals on a chart to support your strategy.
In this case I will create an intraday trading scenario, so I will start observing the market (STEEMUSDT) in the daily timeframe. Take a look at the following image.
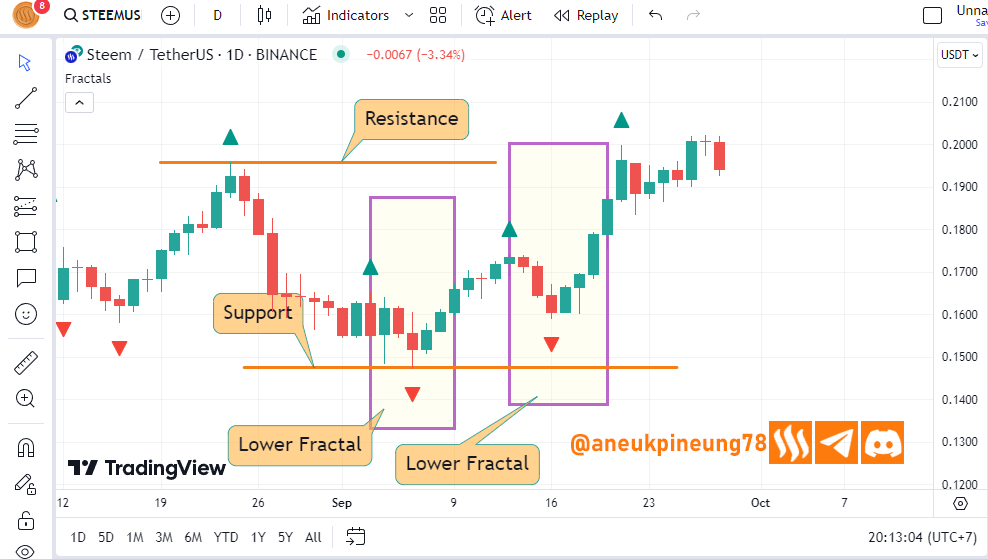
Since the beginning of September, based on the daily timeframe as seen on the screenshot above, there have been 2 Lower Fractals on the STEEMUSDT chart. The valley of the second Lower Fractal is located higher than the valley of the previous Lower Fractal, which is an early signal that the bullish trend will continue. I the added RSI to confirm the signal.
RSI confirmed that the bullish trend is likely to continue by showing the line above level 50.
Now I need the to change to a lower timeframe for intraday trading. I used the 4-h timeframe, and set my entry point with confidence.
Task 5 - Analyze Steem’s Current Market Trend with Fractals Analyze Steem’s current market position using fractals. Where do you think the Steem token is in its fractal cycle (bullish or bearish)? What are the next possible moves? Support your analysis with other indicators such as RSI or moving averages.
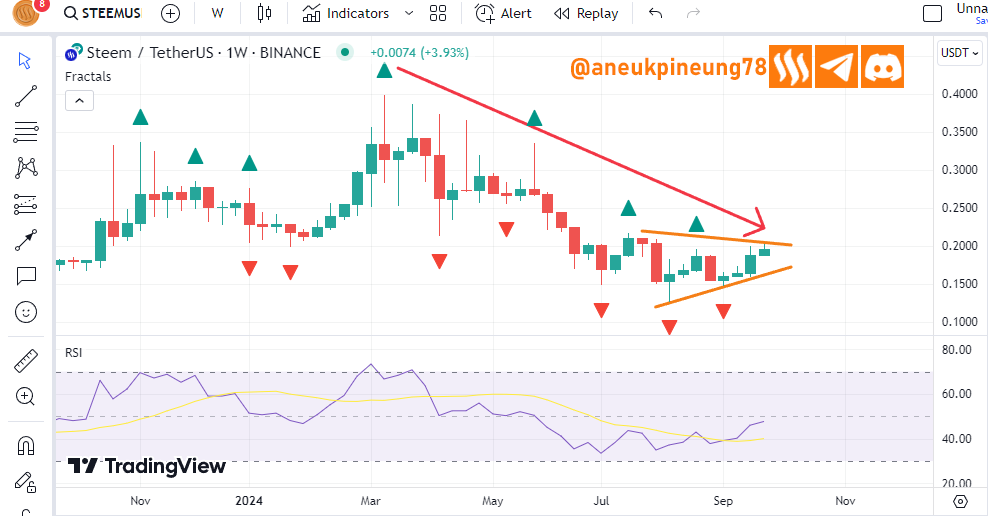
As seen in the 4th task above, through observation on the daily timeframe, STEEM is currently in a bullish phase and confirmed by RSI. However, when we look through the weekly timeframe as shown in the screenshot below, STEEM is in a bearish phase with a high possibility of changing direction, as seen from the last Fractal which is higher than the previous Fractal, and also the direction of movement of the RSI which seems to be trying to cut the 50 level line from below.
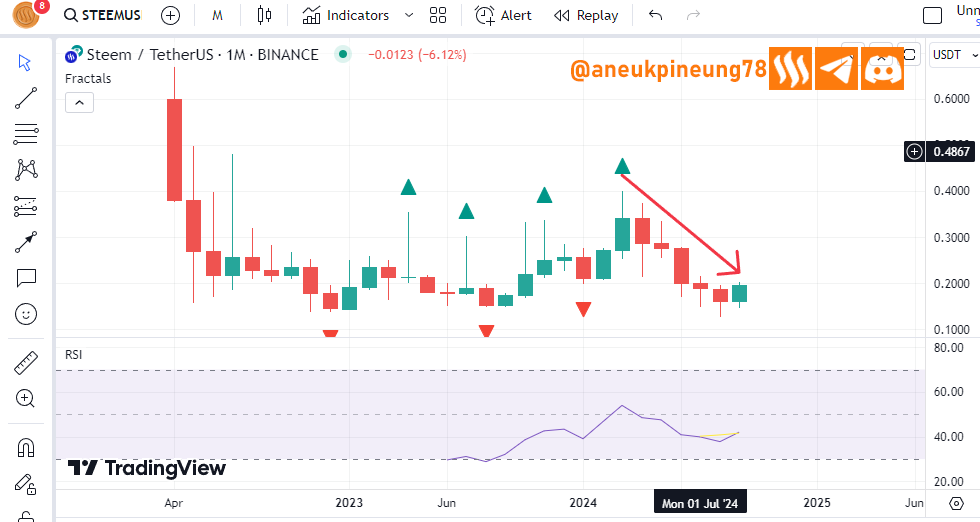
If the observation is made on the monthly timeframe, as shown in the screenshot below, the STEEM market is depicted as being in a bearish position and a Lower Fractal has not yet formed so there is no sign of a reversal.
Conclusion
- Fractals help traders spot trend reversal signals so they can plan ahead for market positioning.
- The most popular, easy, and highly recommended risk management tool like the use of other technical analysis tools can be used to confirm signals or filter out false signals, making decision-making more logical and scientific.
- Observations on three different timeframes of the current state of the STEEM market using Fractals leads to conclusion that the STEEM market is currently offering opportunities in intraday and daily short-term trading, while long-term investment as short as weekly is still not recommended, not to mention the longer terms.
- This shows that observation on multiple timeframes is necessary, to get a more detailed picture of the big trends that are forming on large timeframes, and the hidden opportunities that can be found on smaller timeframes.
Thanks
Thanks @crypto-academy for the lesson.
Pictures Sources
- The editorial picture was created by me.
- Unless otherwise stated, all another pictures were screenshoots and were edited with Adobe Photoshop 2021.
Sources and Reading Suggestion
- https://www.investopedia.com/articles/trading/06/fractals.asp
- https://www.investopedia.com/terms/f/fractal.asp
- https://fbs.eu/en/analytics/guidebooks/fractals-251
- https://fractals.market/
- https://www.britannica.com/science/chaos-theory
- https://brilliant.org/wiki/chaos-theory/
- https://en.wikipedia.org/wiki/Chaos_theory
- https://en.wikipedia.org/wiki/Bill_Williams_(trader)
- https://profitunity.com/bill-williams/
- http://traders.com/documentation/feedbk_docs/2008/07/Interview/interview.html
- https://www.masterforex-v.org/wiki/bill_williams.html
- https://tradeciety.com/how-to-perform-a-multiple-time-frame-analysis
- https://www.babypips.com/learn/forex/multiple-time-frame-analysis
- https://www.oanda.com/us-en/trade-tap-blog/trading-tools-strategies/analysis-multi-timeframe-better-entries-exits/
- https://www.foreximf.com/blog/multiple-time-frame-analysis-trading-forex


https://x.com/aneukpineung78/status/1840071495986651157
You have a given good explanation of the fractals which give help us to determine the next possible movement of the price.
The bullish as well as bearish fractals are also helpful regarding our entries and exit criteria in the market.
We can validate the fractals with the help of the other technical indicators. RSI is one of them which helps us to validate the bullish and bearish signal.
Best wishes.
Your experience with fractal theory and multi-timeframe analysis is outstanding.
It will definitely help many to succeed in the Steem market.
Good luck for the contest.