[In-depth Study of Market Maker Concept]-Steemit Crypto Academy | S4W6 | Homework Post for @reddileep
This is my homework post for Steemit Crypto Academy Season 4 Week 6 of Professor @reddileep’s class of In-depth Study of Market Maker Concept.
Task 1 - The Concept of Market Making
Market making, literally means "the process of making a market". In trading terms, the translation becomes a little more complex: the process of providing liquidity. But how? Providing liquidity is done by creating supply and demand.
What is liquidity? Liquidity is the ease of converting an asset into cash. An example of a liquid asset is gold, because it can be sold easily at any time.
So, simply put, market making is an attempt to create supply and demand for an asset, so that an asset becomes easy to trade, because its liquidity increases.
The person who “makes the market” is called the Market Maker. Market makers trade using the Limit Order method. With this method, a person will only make a sale or purchase if certain conditions are met.
Examples of Limit Orders purchasing:
- bid order: today the price of asset A is USD50, and you fill the order book to buy some amount of A if the price drops to USD49.90.
- ask order: today the price of asset A is USD50, and you fill the order book to sell some amount of A if the price rises to USD50.10.
With the explanation above, we can conclude that Market Maker is needed to increase the transaction of an asset in a market. Market making will attract investors to come, and with it the Order Book can increase, increasing orders will increase liquidity, good liquidity will increase the number of Market Takers (people or funds that react to orders in the Order Book), and in turn will increase market volume. This can be explained simply by the following flowchart.


Task 2 - The Psychology Behind Market Maker
Market makers seek to profit by taking advantage of the differences in the buy and ask spreads. For example, a potential investor searches for an asset in the market and finds a bid price of USD 50.55 and an ask price of USD 50.60, which means that for every successful purchase and sale of 1 asset, the Market Maker will earn a profit of USD 0.05. It may seem a bit, but Market Makers usually don't trade with "small" money. Imagine if he did, say a successful trade with the amount of 1,000,000 assets, then that would mean a profit of USD 50,000.
The psychology is very simple, exactly the most basic rule of trading: sell at a higher price than the purchase. Let's see the following picture which is a screenshot of the market on steemitwallet.
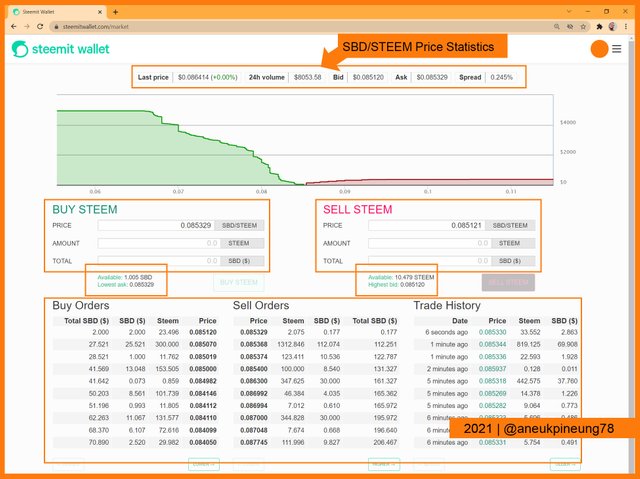
The figure shows the following information:
- Last Price : 0.086414 SBD/STEEM
- 24hour Volume : 8053.58 SBD
- Bid : 0.085120 SBD/STEEM
- Ask : 0.085329 SBD/STEEM
- Spreads : 0.245%
From the statistics above, it can be seen that the market psychology shows that the ask (selling price) is higher than the bid (buying price offer).
In the SteemitWallet market, as shown in the picture above, anyone can become a Market Maker by filling out an Order Book: whether they want to buy STEEM or sell it. Buying STEEM means converting SBD to STEEM, and selling STEEM means converting STEEM to SBD. Under the Order Book section is the wallet STEEM and SBD balance.
At the lower section of the page, a list of Buy Orders and Sell Orders is shown, right next to Trade History section. Both are requests that are available for investors to fill. If someone comes to the market and makes an offer to buy STEEM at a certain price, then the market will automatically look for a suitable sell offer available. This means that everyone can be a Market Maker and a Market Taker at the same time.
In order for a STEEM purchase order to be fulfilled as quickly as possible, a Market Maker can make a buy offer at a slightly higher price than the last effective price, or at least the same. For example, as in the image above, the last price was 0.086414 SBD/STEEM, someone who wants some STEEM quickly can offer at a price of 0.087 SBD/STEEM or even higher. But someone who is not in a hurry, and thinks that the price of STEEM against SBD will drop in the near future, can fill the Order Book with a cheaper price, for example 0.085 SBD/STEEM or even cheaper than that.
Does Market Maker not face any risk? There is always risk in investing. Price changes can occur at any time and when they are not anticipated in advance will cost the Market Maker money. Placing an order at a low price can also be counterproductive if it turns out that the price suddenly rises quickly, and vice versa.

Task 3 - The Benefits of Market Maker Concept
The advantages provided by the Market Maker concept are:
- Most important of all, bringing in and ensuring the continuity of market liquidity, with which trades will continue to take place.
- Market Makers contribute to influencing the price of assets that are too low or too high and bring them to a more "logical" price. In turn, this help regulates the market.
- Market Making makes the trading process for investors easier.

Task 4 - The Disadvantages of Market Maker Concept
The disadvantages of the Market Making Concept are:
- Market Makers can send wrong information to the market because of their ability to manipulate prices.
- Small investors can be helpless when dealing with Market Makers if Market Makers (they have very large capital and are able to influence the market) do something speculative, such as taking large-scale profit all of a sudden. That is, Market Maker has the ability to cause losses to investors with small capital.

Task 5 - Two Indicators Used in the Market Maker Concept
Two of the indicators that can be used are Double EMA (Double EMA or DEMA) and Williams Percent Rate (WPR)
5.1. Double Exponential Moving Average (Double EMA / DEMA) and Chart
Double EMA is the use of two Exponential Moving Averages on a single chart. One EMA represents an observation for a lower timeframe than the other. For example, the combination of EMA-15 and EMA-50 as one of the popular combinations.
Double EMA can be used to confirm trend reversal or continuation signals. This is done by forming a cross called Golden Cross or Death Cross.
- A Golden Cross occurs when the short-term moving average crosses the long-term moving average from below and stays above the long-term moving average for some time. Golden Cross is a trend reversal signal towards bullish conditions.
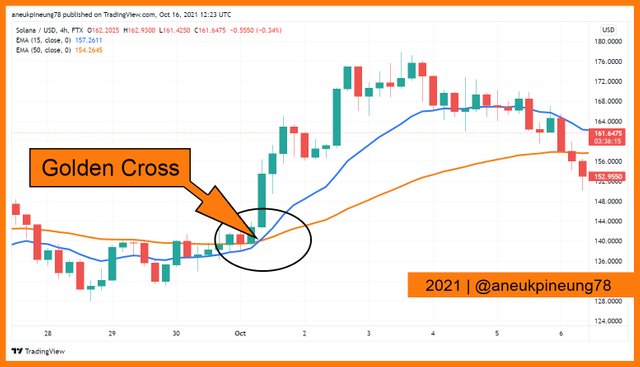
The Golden Cross is effective to detect a new bullish market. Picture is the screenshot image of SOL/USD 4h chart from TradingView. Indicators used: EMA-15 (blue) and EMA-50 (orange). - Death Cross is the opposite of Golden Cross, occurs when the long-term moving average line crosses the short-term moving average line from below. This is a signal that the market will experience a bearish trend.
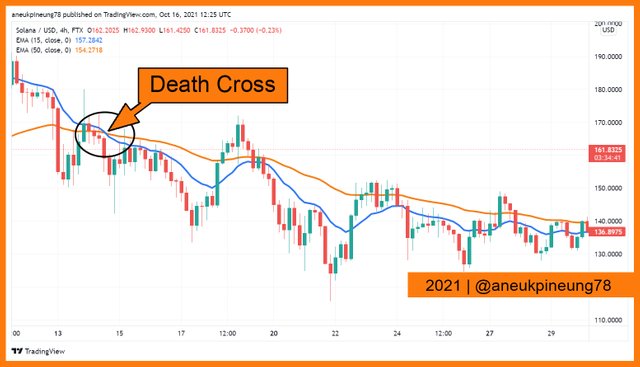
The Death Cross is effective to detect upcoming bearish market. Picture is the screenshot image of SOL/USD 4h chart from TradingView. Indicators used: EMA-15 (blue) and EMA-50 (orange). - Double EMA can help detect false signals, simply by ignoring them and not showing a crossover.
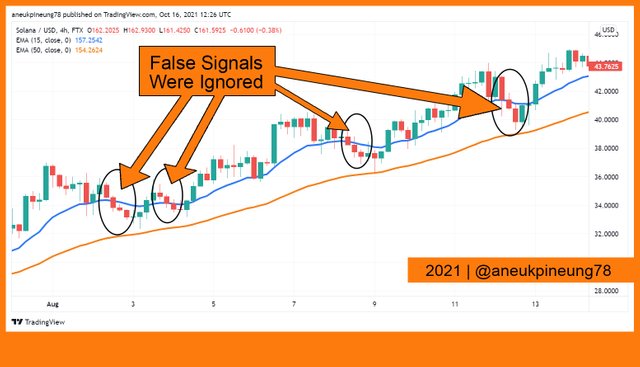
No crosses simply mean no upcoming trend reversal. Picture is the screenshot image of SOL/USD 4h chart from TradingView. Indicators used: EMA-15 (blue) and EMA-50 (orange).
5.2. Williams Percent Rate (WPR) and Chart
Williams Percent Rate is an indicator that belongs to the technical analysis group and is an oscillator type. William Percent Rate works by collecting data on the highest, lowest, and recent close prices within a certain period (the lookback period is usually 14 days), then calculates it with a certain formula to get the Percent Rate number every day. The Percent Rate line is made based on the daily Percent Rate figures.
The WPR chart, as an oscillator, is located separately from the price chart, it can be above or below the chart.
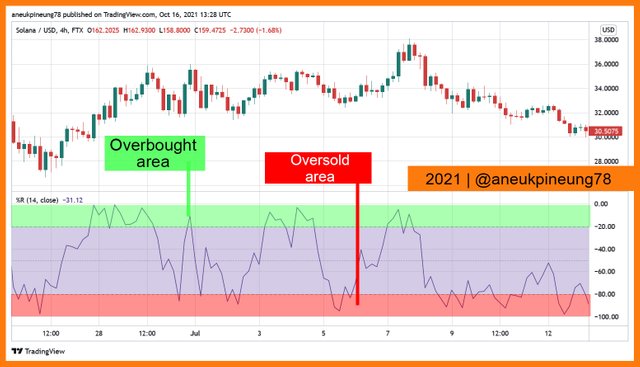
In WPR, the chart area is divided into negative areas (-100% - 0) Users can set limits to draw conclusions about oversold or overbought in the market.
- Oversold is considered to occur if the WPR line goes lower to the lower limit set (usually -80%). This can be considered as an early signal of the emergence of a bearish market. Oversold is considered a signal to enter a long position (buy entry).
- Overbought occurs when the WPR line goes higher to a set high (usually -20%). This is considered a signal of a potential bullish market, a signal for traders to enter a short position (sell entry).
Below is a screenshot image of the SOL/USD chart on a 4-hour timeframe as seen on TradingView, with the addition of the Williams Percent Rate indicator.

Thanks
Thanks Professor @reddileep for the lesson titled In-depth Study of Market Maker Concept.
Pictures Sourcing
- The editorial picture was created by me.
- Unless otherwise stated, all another pictures were screenshoots and were edited with Photoshop CS 3.
Sources and Reading Suggestion
- https://www.investopedia.com/terms/m/marketmaker.asp;
- https://zipmex.com/id/learn/apa-itu-market-maker-dan-mengapa-dibutuhkan/;
- https://forexindonesia.info/belajarforex/apa-itu-market-maker-dan-bagaimana-mereka-menghasilkan-uang.html;
- https://investasi.kontan.co.id/news/bei-terus-menggodok-peraturan-market-maker;
- https://www.cnbcindonesia.com/market/20210929151218-17-280134/cegah-goreng-saham-aturan-market-maker-meluncur-2022;
- https://investor.id/market-and-corporate/265049/aturan-market-maker-diluncurkan-semester-ii2022;
- https://careers.imc.com/us/en/blogarticle/what-is-market-making;
- https://blog.quantinsti.com/market-making/;
- https://finance.yahoo.com/news/market-maker-why-them-220934239.html;
- https://bitocto.com/octopedia/apa-itu-market-maker-market-taker/;
- https://www.pikirantrader.com/broker/17066-kelebihan-dan-kekurangan-broker-market-maker;


Shared to Twitter : https://twitter.com/aneukpineung78a/status/1449376454702075904.