Crypto Trading With Rate of Change (RoC) Indicator - Crypto Academy / S4W8 - Homework Post for @kouba01
This is my homework post for Steemit Crypto Academy Season 4 Week 8 of Professor @kouba01’s class Crypto Trading With Rate of Change (RoC) Indicator.

Task 1 – Rate of Change (RoC) Indicator: The Meaning and Calculation Example
1.1. RoC Indicator Is …
Rate of Change (RoC) is a trading technical analysis tool, which is grouped in to the momentum indicators of the oscillator type. This tool compares price movements between certain “moments”. In using this indicator, users need to set a time span (period) for calculating the RoC value. For example, a user sets a period of 20 days, then the indicator will measure price changes that occur on a certain day compared to the price of 20 days before, and show the result in percentage. The RoC value can be negative or positive. Negative and positive values are separated by a horizontal zero line.
Users can set to use the Price type they prefer, it might be Close, High, Low, or any combination they’d like.
1.2. The ROC Indicator Value Calculation Example
1.2.1. The Formula
The theoretical description above can be refined into the formula:
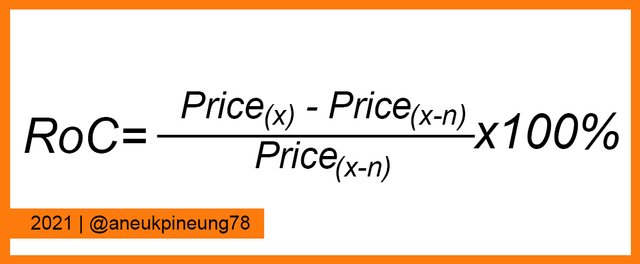
Where:
- Price(x) = Price on a certain day.
- Price(x-n) = Price on a certain day of n-period back.
1.2.2. Calculation Simulation
How to put it into practice, for example: a user set RoC for a 13 days period. They want to see Rate of Change on the 27th. The RoC of that day was in correlation with the price on the 14th (13 days before the 27th). Say, the data was:
- the price on the 27th was 23.76
- the price on the 14th was 31.84
The RoC value on the 27th was:
RoC = ((Price on the 27th - Price on the 14th) / Price on the 14th)) * 100%
RoC = ((23.76 - 31.84) / 31.84) * 100%
RoC = (-8.08 / 31.84) * 100%
RoC = -25.38%
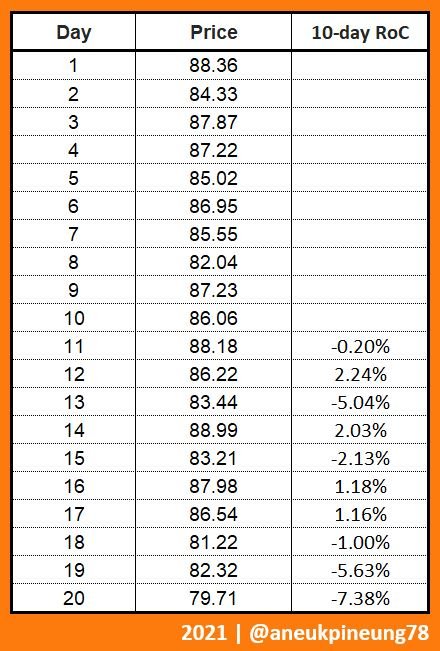
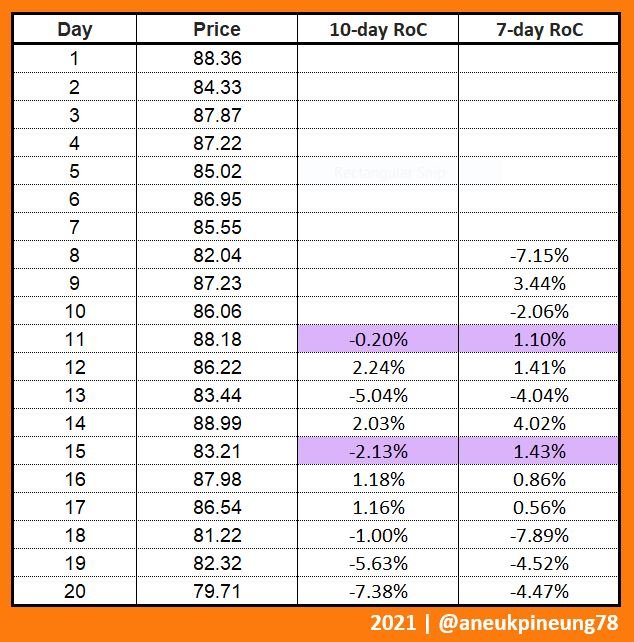
The following is an example of a 20 days price data table and a 10-day RoC calculation.
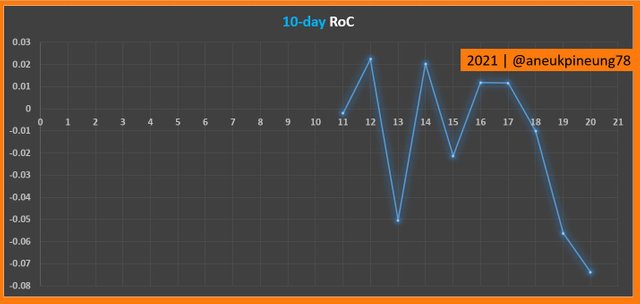
The graph for the data looks like this
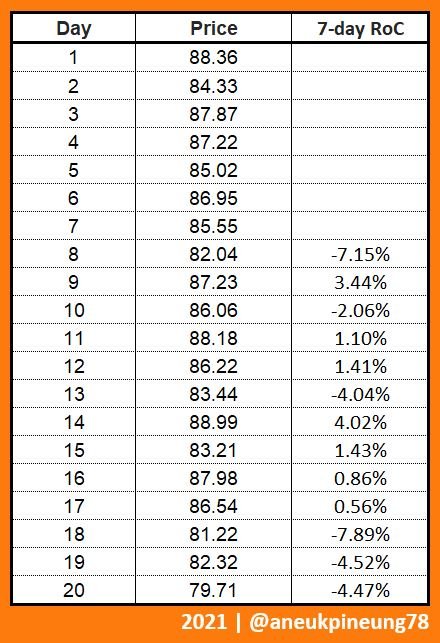
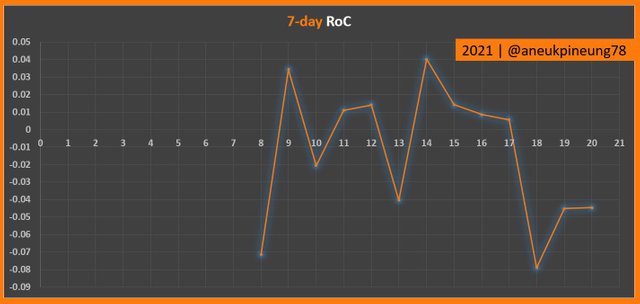
Now let’s put the same data on a 7-day period RoC. Here comes the table.
And here is the graph.
1.3. My Comment on The Result
As a momentum indicator, RoC tracks and calculates the data based on the “moment” (lookback period) given. The value should always be taken in correlation with certain days back. Different RoC value will be shown on a certain day when observed with different lookback period. Some might give a strict different value (between negative and positive). For example, on the example data above, the 11th and 15th day, the 10-day RoC values for both days were negative (-0.20% and -2.13% respectively), while the 7-day RoC shows positive values (1.10% and 1.43% respectively).
So, RoC is totally related to the lookback period set by the users. How a user find a suitable setting for his trade might be subject to experience.

Task 2 – RoC Indicator on A non-TradingView Chart
2.1. Adding RoC Indicator on to A non-TradingView Chart
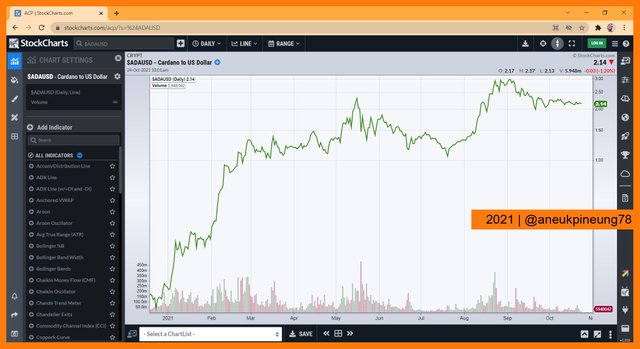
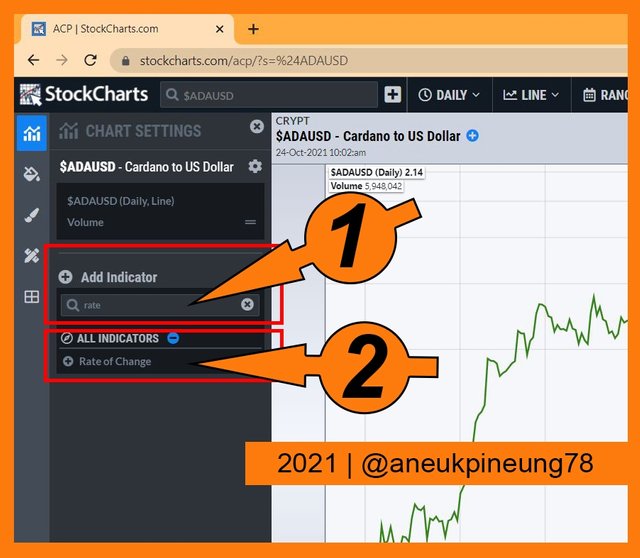
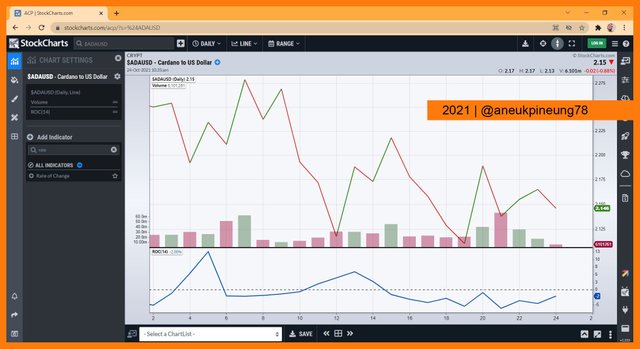
For this task I used ADA/USD chart from stockcharts.com on daily timeframe.
2.2. Setting Up the RoC Indicator on the Chart
On the left pane of the window, I used the Add Indicator search box to easily search for Rate of Change (marker number (1)). I hit the relevant one from the result list (which was only one related to keyword “rate”) (marker number (2)).
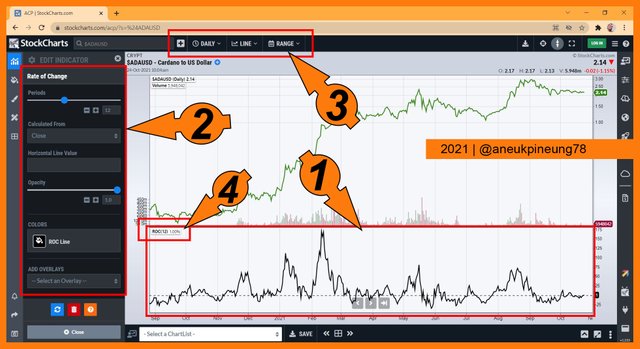
RoC indicator showed under the price chart, as indicated by marker number (1) on the picture below. The left pane (indicated by marker number (2)), changed to the indicator editing mode. Marker number (3) indicated the panel to change timeframe, chart type (line, candlesticks, etc.), and time range. The marker number (4) showed the site indicator default setting (which was 12-day) and value (1%).
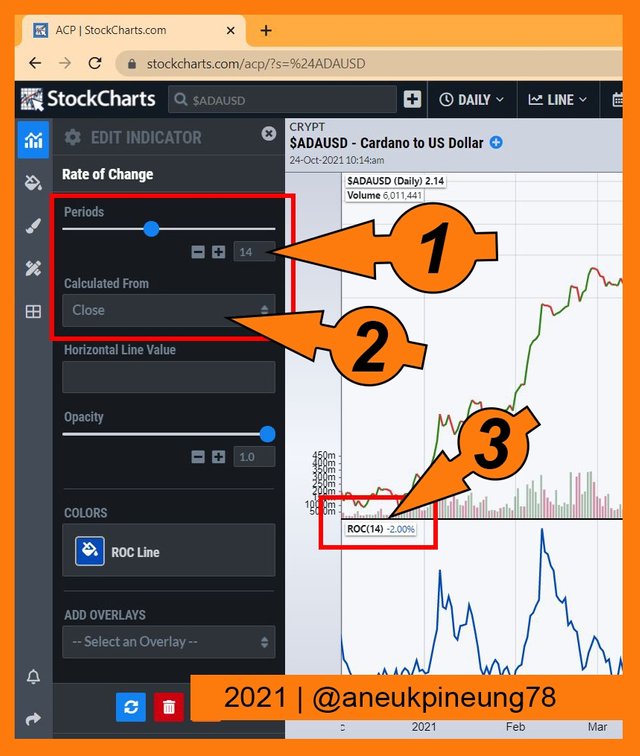
I made change to the indicator parameter setting by changing the period to 14-day simply by typing it in (indicated by marker number (1) on the picture below). I left the price source as its default setting (Close), as indicated by marker number (2). The period changing caused the RoC value change as indicated by marker number (3), it changed to -2.00%.
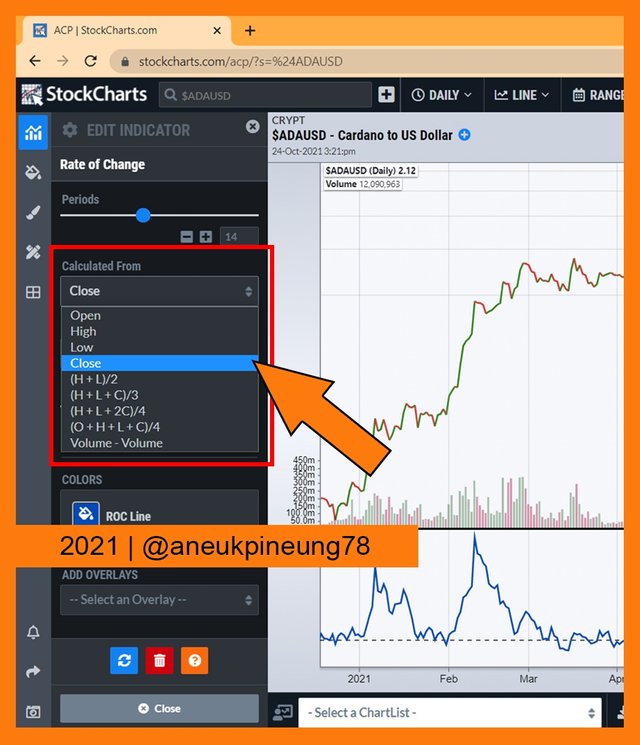
Users can choose the preferred calculation source as shown on the picture below. It can be Close, or High, Low, average of High and Low ((H+L)/2), and so on.
Below is the zoomed image of the chart, shows the condition for the last 3 weeks.
2.3. The Best Setting
On the above task, I performed the period changing from 12-day to 14-day. By that, the RoC value changed from 1.00% to -2.00%. It does not indicate whether one of the two settings is better than the other. Users can use one of the two settings, or can even observe both and make comparisons, or even use completely different period settings, for example 7-day or 6-day and so on.
In my opinion, the best RoC settings depend on users’ needs. Longer periods may be more suitable for longer term trading, for example 14-day RoC is more suitable for longer term trading than of 7-day RoC.
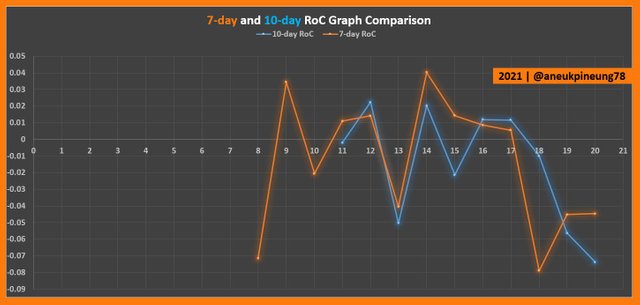
Let’s take the above example of comparison graph for a study.
The graph above shows that although there was a difference in the value of RoC between the two periods, the trend line was the same. It was probably because the period difference was only 2 days. To gain better perspective, I experimented by generating a 3-day RoC from the same data and by that a comparison chart as shown in the following image.
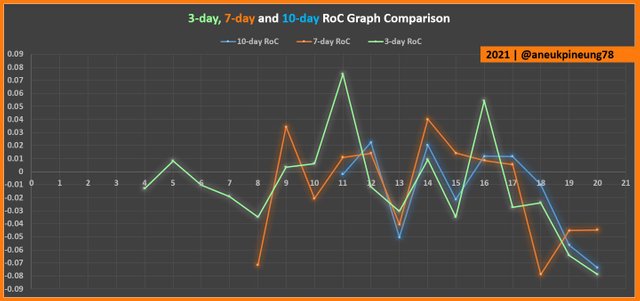
The three RoC lines on the picture above show the same trend since the 11th, downtrend. Meanwhile, 3-day RoC and 7-day RoC produce different conclusions if the observations are made from the 8th. According to the 3-day RoC, from the 8th to the 20th, there was a downtrend, while for the same time span, the 7-day RoC shows an uptrend.
Meanwhile, for the time span between the 18th and the 20th, the 3-day and 10-day RoC shows a downtrend, in contrast to the line generated by the 7-day RoC. However, all three lines are below the zero line, starting with the 3-day RoC line crossed the zero line on the 17th and two more RoCs followed the next day.
So, in my opinion, every trader can determine the setting that they think is best for their trades, and that is closely related to the type of trading they are doing (shorter term or longer term), although various sources say that RoC is more suitable for long term trading. Even two charting platforms (for example) TradingView and StockChart, give different default values for RoC. TradingView’s default value for RoC is 9 (9-day) while StockChart’s is 12-day.
I haven't found through research on the internet any references that explain a definite correlation between the RoC period and the exact trading activity.
Task 3 - RoC Trend Confirmation Strategy and Trend Reversal Signals
3.1. What Is RoC Trend Confirmation Strategy?
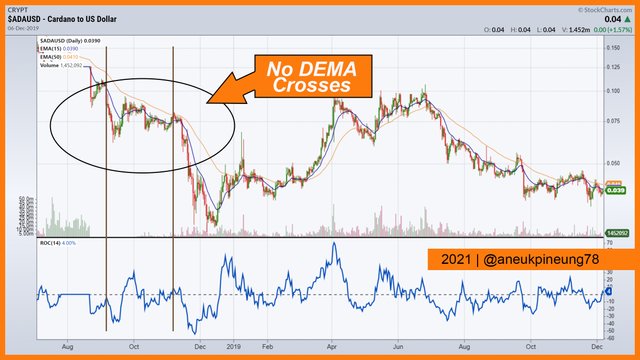
RoC, like another oscillator type indicators (to name one: Williams Percent Range), is effective in helping users identify trends early by generating some signals (overbought and oversold). But to effectively confirms whether a trend will perform continuation or a reversal will occur, a combination with other technical indicators is needed. Everyone may have a certain type of technical analysis indicator that they prefer to combine with RoC, in turn to getting a “stronger belief” on a signal. I myself found that Double EMA (DEMA) suits my need on this matter.
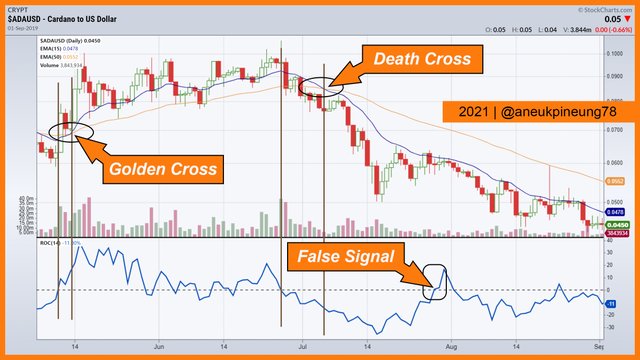
The picture above shows how Double EMA effectively confirmed trend reversal. It might take some times after RoC signaling a trend reversal possibility, but it is worth to wait to get confirmed, since DEMA is also effective to confirm false signals.
3.2. The Signals That Detect A Trend Reversal
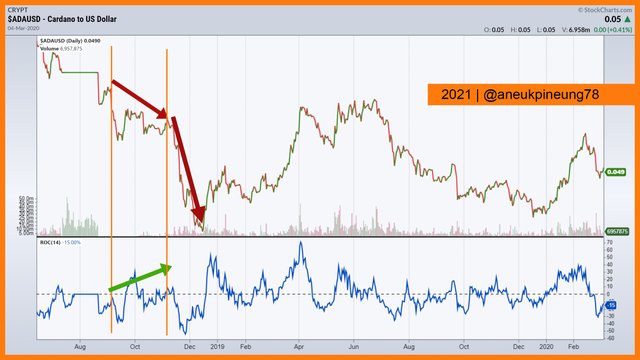
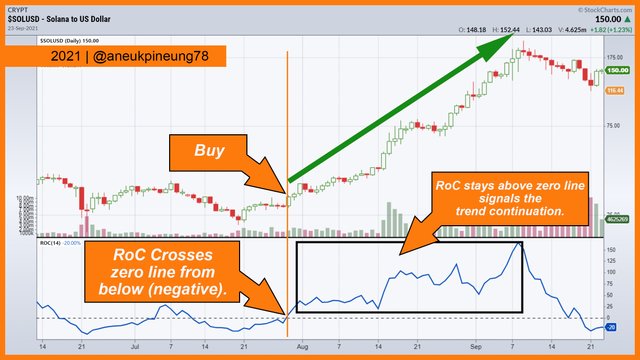
In RoC indicator, trend reversal signals are detected when the RoC line crosses the zero line. When it crosses the zero line from positive area (above zero line) to negative area (below zero line), the trend reversal from bullish to bearish is likely to happen soon, and vise versa. See the picture below for example.

The picture above shows that the crossing of the zero line from the negative area by the RoC line (marked number (01)) was followed by a change in the trend towards bullish. And the zero line cuts from the positive area (marked number (03)), followed by a change in the trend towards bearish. While the marker number (2) and marker number (4) confirms the theory that if the price continues to increase then the RoC line remains above the zero line, and if the price continues to decline, the RoC line will remain below the zero line.
Task 4 - The Indicator’s Role In Determining Buy And Sell Decisions And Identifying Overbought And Oversold Signals
4.1. Buy and Sell Positions
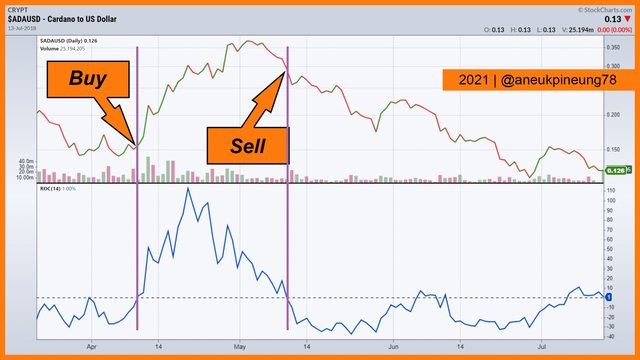
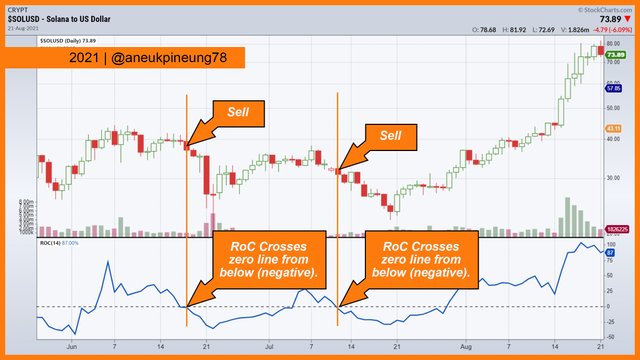
Basically, a buy position is made when the RoC line crosses the zero line from the negative area to the positive area. And the sell position is made when the zero line is crossed from the positive to the negative direction.
4.2. Overbought and Oversold Signals
RoC is an oscillator that differs from other oscillators in term that RoC does not have a value range (lowest and highest values). This causes the setting of overbought and oversold values to be a bit difficult. The recommended way to determine overbought and oversold in RoC is by observing the price history.
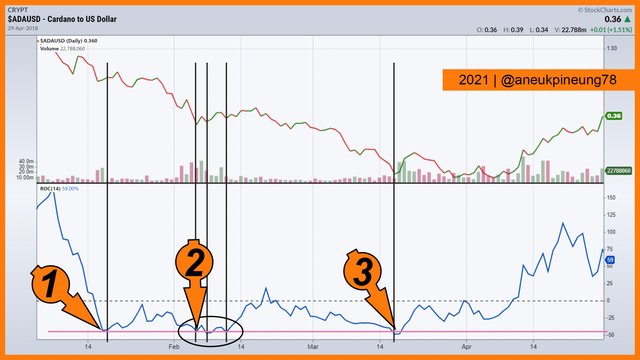
4.2.1. Oversold
The picture below shows that the historical oversold values (marked number (1) and number (2)) for ADA/USD was between -45% to -50%, and marker number (3) confirms that it was effective to put the oversold value on that area.
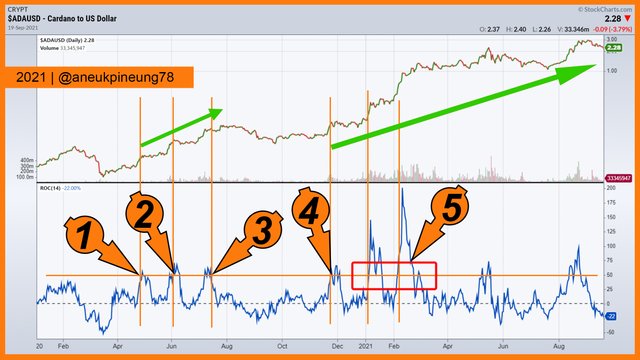
4.2.2. Overbought
By observing the historical overbought of this asset (ADA/USD), as indicated by the markers number (1), (2) and (3) in the picture below, I concluded that overbought is effective to be placed at 50%. It’s proven when the RoC line then hits overbought again (at markers (4) and (5)), trend continuation occurs.
Task 5 – Trading With The Price Line and RoC Indicator Divergence
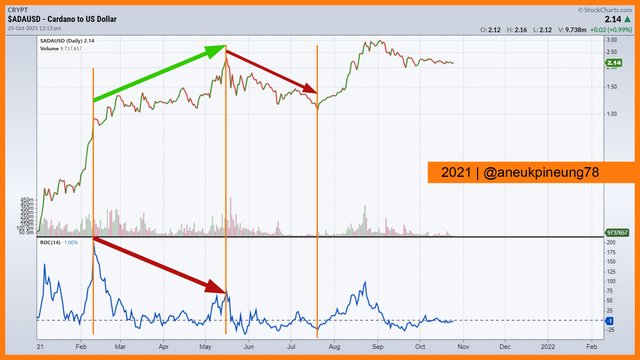
5.1. Bearish Divergence
Bearish Divergence happens when the price line shows uptrend while the RoC line shows the downtrend. As name implies, this divergence leads to bearish market.
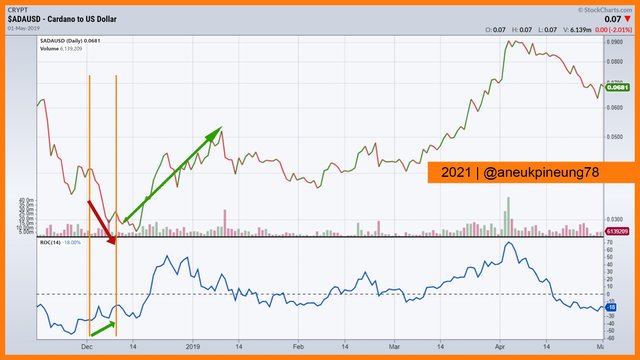
5.2. Bullish Divergence
Bullish Divergence is the opposite of the bearish one. It happens when RoC line shows uptrend while price line moves as a downtrend. It basically is a good signal that leads to bullish market.
5.3. False Signals
But, be aware enough, False Signals may occurs at any time. When bullish and bearish divergences put the RoC line “in charge”, it works the other way around with false signals. On divergences false signals, rather than following the RoC trend, the upcoming trend follows the current price line trend. In the example below, the RoC line shows uptrend and price line goes on a downtrend, base on the theory it should be a “good sign” bullish divergence, but the picture shows that the price line does not follow that rule.
And that’s why a confirmation analysis tool would be a good, effective decision. Let’s combine the RoC with DEMA as seen on the picture below.
The picture above shows that DEMA was effective to alarming a trader that no trend reversal will follow the divergence.
Task 6 – Using RoC Indicator to Identify and Confirm Breakouts
6.1. Resistance Breakout
Resistance breakout occurs when the asset’s price moves above the resistance line. The picture below shows an example of the resistance breakout.
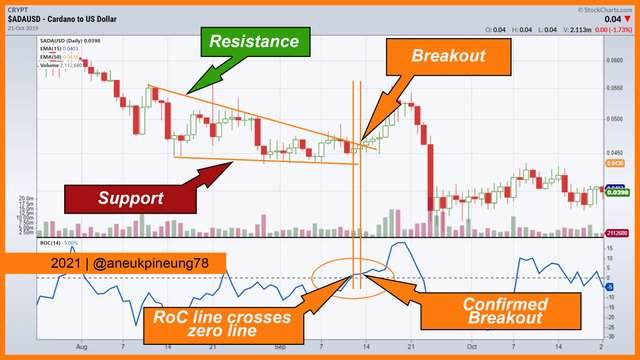
The picture shows that the resistance breakout was preceded by the crossing of zero line from negative area. When RoC line stayed above the zero line, the breakout was soon confirmed. The resistance breakout leads to uptrend.
6.2. Support Breakout
Support breakout is the opposite to the resistance breakout. It is when the price moves below the support line. Below is the example of the support breakout.
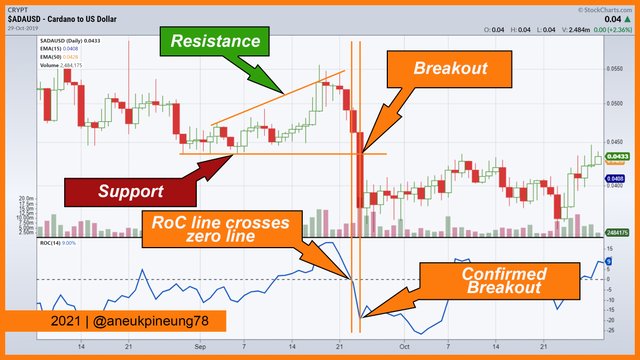
The picture shows that the support breakout was preceded by RoC line crossed the zero line from positive area (above). And when the RoC line stayed below the aero line for some times, the breakout was confirmed.
Task 7 – Chart Reviewing
7.1. The ROC Indicator on A Crypto Pair Chart
For this task I used the Solana/USD (SOL/USD) daily chart from StockChart as seen here. The RoC was calculated from Close price.
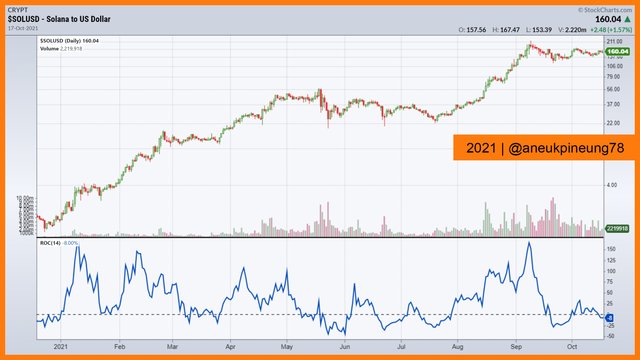
7.2. Observed Signals Given by ROC Indicator
The The SOL/USD daily price chart I was able to detect various signals generated by RoC as follow:
- Bullish. Bullish signals are taken when RoC crosses zero line from below (negative area). It is confirmed a bullish market when RoC stays above the zero line.
Bullish signal. - Bearish. When RoC crosses zero line from above (positive area), it is basically an early sign of a bearish market. It is confirmed a bearish market when RoC stays below the zero line for some times.
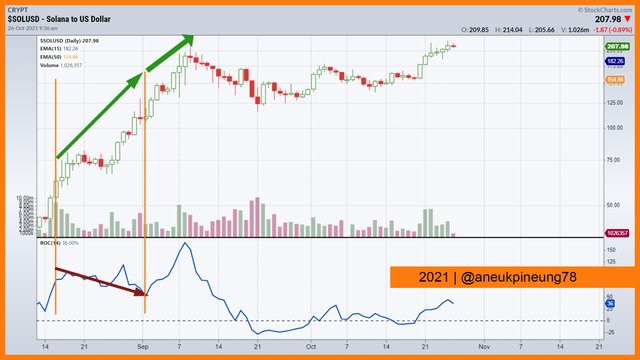
Bearish signal. - Bearish Divergence. If the chart shows that price is moving up while the RoC shows that it’s moving to opposite direction, then likely a bearish market is imminent.
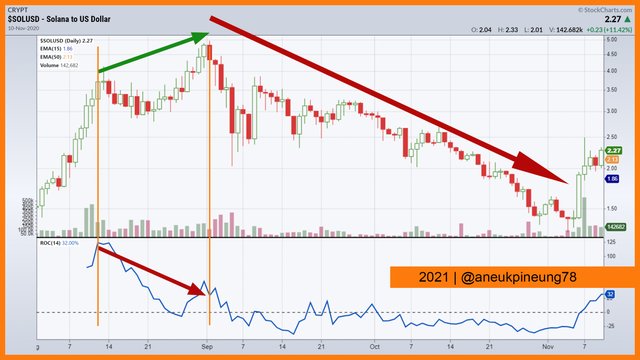
Bearish Divergence. - False Divergence. Divergence happens when price chart shows different trend from what RoC shows, and the trend that follows is the trend suggested by the RoC. But when the different trend shown by RoC and price chart, and the following trend was one suggested by price chart, it is considered a false divergence. Below is the example of false divergence when that shows how price trend ignores the trend suggested by RoC.
False divergence.
If the RoC was combined with another tool, it might be confirmed earlier before a trader make a wrong move. Let’s see if the chart was observed with the help of Double EMA as shown below.
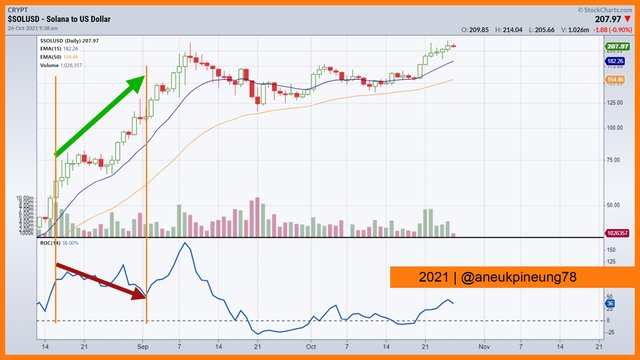
DEMA helps traders ignores the false divergence signal. - Support Breakout. It happens when price “break” the “lower barrier” (support line). Example is shown below.
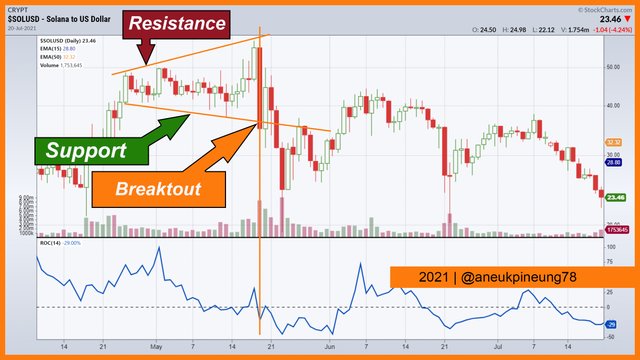
Support has been broken. - Resistance Breakout. It happens when price breaks the “upper barrier” (resistance line) and moves above it. Here is an example.
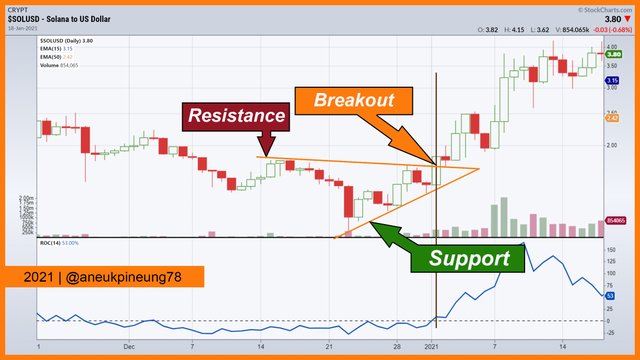
Resistance has been broken.
Task 8 - Conclusion
RoC as momentum indicator that can be used by traders to get a better picture and understanding of what is going on in the market. It is of oscillator type indicators, but without value range.
Pros
- Bearish and bullish signals. This oscillator type indicator works by detecting bearish and bullish signals, simply by showing the crossing of zero line by RoC line.
- Divergences. One of the advantages of RoC is that because this indicator is an oscillator type, it can be used to detect divergences. Divergences are always effective for reporting trend reversals. But no indicator is perfect, RoC can also generate false divergence signals.
- Oversold and Overbought Levels. These levels work and function the same with William Percent Range’s oversold and overbought levels, to generate early signal of new trend. Differs from Williams Percent Range in which these levels can be set in the indicator parameter setting, the RoC does not have the setting for overbought and oversold levels. Traders have to do it manually by observing the historical overbought and oversold level.
- Breakouts. Traders can expect breakouts to appear after seeing bearish and bullish signals (when the RoC crosses the zero line). If the RoC stays in the new area for some time, it is likely that a breakout will occur.
Cons
- False Signals. Just like other indicators, not perfect, so is RoC. This indicator can be used to get an early prediction of what will happen in the market, but false signals can also appear at any time.
Suggestion
It is highly recommended to use RoC with the help of other technical indicators that are considered suitable by each trader. This is to help traders confirm the signals generated by the RoC and vice versa.
Thanks
Thanks Professor @kouba01 for the lesson titled Crypto Trading With Rate Of Change (ROC) Indicator.
Pictures Sourcing
- The editorial picture was created by me.
- Unless otherwise stated, all another pictures were screenshoots and were edited with Photoshop CS 3.
Sources and Reading Suggestion
- https://steemit.com/hive-108451/@kouba01/crypto-academy-season-4-advanced-course-week-8-crypto-trading-with-rate-of-change-roc-indicator;
- https://www.investopedia.com/terms/p/pricerateofchange.asp;
- https://www.tradingview.com/scripts/rateofchange/;
- https://www.fidelity.com/learning-center/trading-investing/technical-analysis/technical-indicator-guide/roc;
- https://www.tradingtechnologies.com/xtrader-help/x-study/technical-indicator-definitions/rate-of-change-roc/;
- https://school.stockcharts.com/doku.php?id=technical_indicators:rate_of_change_roc_and_momentum;
- https://www.elearnmarkets.com/blog/rate-of-change/;
- https://www.inbizia.com/apa-itu-breakout-trading-489;
- https://findependence.org/how-to-profit-from-a-breakout/;
- https://www.investopedia.com/articles/trading/08/trading-breakouts.asp;
- https://www.investopedia.com/articles/trading/08/trading-breakouts.asp;
- https://www.investopedia.com/articles/trading/10/3-reasons-not-to-trade-range-breakouts.asp;
- https://www.thebalance.com/three-better-ways-to-day-trade-breakouts-1030880;
- https://www.seputarforex.com/artikel/penjelasan-tentang-strategi-breakout-121009-31;


shared to Twitter: https://twitter.com/aneukpineung78a/status/1454445657721163781
Hi @aneukpineung78,
I prefer to upvote users who continually powerup their earnings and continually upvote others (preferably like-minded users) with their increasing Steem Power. I notice you are in that category. You will receive my upvotes regularly as long as you maintain this attitude.
Thanks, Devann. I highly appreciate it.
Hello @aneukpineung78,
Thank you for participating in the 8th Week Crypto Course in its 4th season and for your efforts to complete the suggested tasks, you deserve a Total|7.5/10 rating, according to the following scale:
My review :
A good article in which you were able to answer most of the questions ably, and you have some notes that I made.
A good explanation of the ROC indicator and especially how to calculate its value with a good existing example.
You have not deepened your analysis to interpret the (4)(5)and(6) questions.
Thanks again for your effort, and we look forward to reading your next work.
Sincerely,@kouba01
Thanks, Professor. I did learn some things.
#club5050 😀
Semakin berkembang sekarang ya bg, saya sendiri masih pemula dan hal dunia cryptocurency, bg ajari saya donk biar bisa aktif lagi di cryptoacademy, soal sekarang semakin sulit sulit, saya kesulitan untuk membuta nya.
iya bang razzor terus berusaha ...tetapsemangat dan terus bersyukur ,,,
Great post I really admire your work🙂I will love to v like you when I grow up😁
Thanks, obrisgold,, I tried my best. I believe you can too.
indeed you really worked for it. thanks for the encouragement