Crypto Trading With Chaikin Money Flow Indicator - Crypto Academy / S4W6 - Homework Post for @kouba01
This is my homework post for Steemit Crypto Academy Season 4 Week 6 of Professor @kouba01’s class, Crypto Trading With Chaikin Money Flow Indicator.

Note : I performed this task on Windows 10 PC, Google Chrome.
Task 1 - About the CMF Indicator
1.1. Explanation

Chaikin Money Flow (CMF) Indicator is a trading technical analysis tool that is grouped into volume indicators of the oscillator type. This indicator is used to monitor a stocks accumulation and distribution (or in other words: Money Flow Volume or trading volume) within a certain time range (or “look back period”, popularly 20 or 21 days) and uses a special formula to calculate it and then presents it in the form of a separate diagram from the observed chart (usually located below the observed chart). This indicator was created by Marc Chaikin in the 1980s. Chaikin is a stock analyst, entrepreneur, and Founder and CEO of Chaikin Analytics, LLC. Besides the CMF Indicator, Chaikin is also known for his other inventions, namely the Chaikin Oscillator and Accumulation/Distribution.
According to tradingview.com, Money Flow Volume is a concept that was created also by Chaikin. It is a metric system used to measure a stock’s buying or selling pressure for a single period [Source]. It is used to try to quantify the amount of money coming into the market and to observe its impact on stock prices.
1.2. How It Works
First, data on trading prices (high, low, and close) and daily trading volume are collected. Everyday trading price data is used to get Money Flow Multiplier (MFM) for that day. The MFM formula is as shown in the image below:

Where:
- MFM = Money Flow Multiplier,
- Close = closing price on that day,
- High = highest price on that day,
- Low = lowest price on that day.
Each day MF Multipler (MFM) is multiplied by that day volume to get Money Flow Volume (MFV) for the day.

When the specified period range is reached (usually 20 or 21 days), the CMF Value is calculated by dividing the amount of MF Volume in the lookback period by the amount of Volume in that lookback period.

1.3. Calculating CMF Indicator Value
Say one day, asset A has the following data:
- highest price = 78.47
- lowest price = 75.69
- close price = 78.24
- volume = 9,478
1.3.1. The MF Multiplier
That day MF Multiplier is:
MFM = [(Close - Low) - (High - Close)] / (High - Low)
MFM = [(78.24 - 75.69) - (78.47 - 78.24)] / (78.47 - 75.69)
MFM = (2.55 - 0.23) / 2.78
MFM = 2.32 / 2.78
MFM = 0.83
1.3.2. The MF Volume
While, MF Volume of that day is:
MFV = MFM * V
MFV = 0.83 * 9,478
MFV = 7,866.74
1.3.3. The CMF Value
If in the specified lookback period, on that day, the following data are found:
- Sum of MF Volume = -28,976
- Sum of Volume = 247,969
The CMF Value for that day is:
CMF = Sum of MF Volume / Sum of Volume
CMF = -28,976 / 247,969
CMF = -0.12
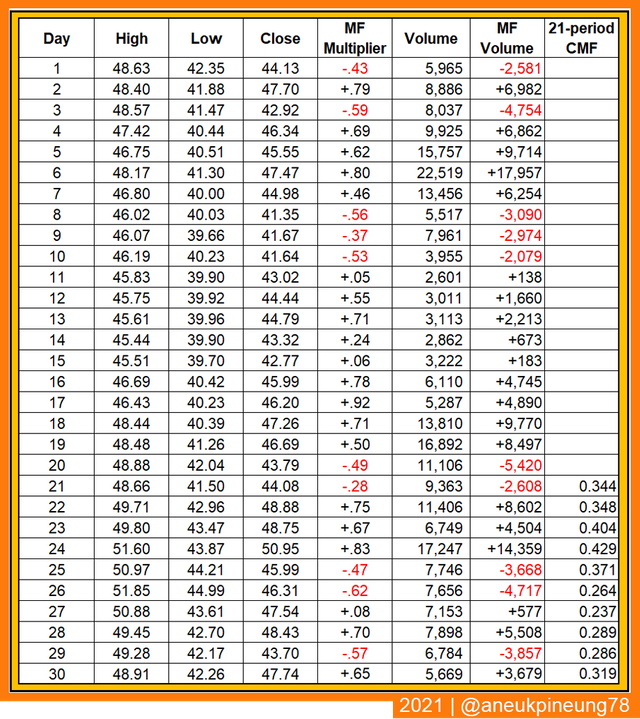
1.4. Sample Table of Data And Results In A 21-Day Period CMF Indicator
The following table provides an illustration of how data for 30 days is processed in the CMF Indicator which has a period span of 21 days.
1.5. Usefulness
The CMF Indicator, as a tool to detect the movement of money in an asset market, can provide information that can help traders get important signals. But the signal reported by the CMF Indicator cannot be taken for granted. Traders are advised to wait for some time until the signal is confirmed before they make a decision in trading. In addition, combining it with other fundamental and technical analysis tools is also recommended as a form of confirmation of emerging signals.

Task 2 - The CMF Indicator on a Chart
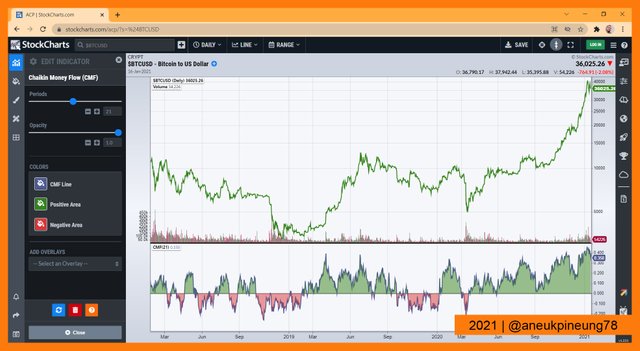
2.1. Adding CMF Indicator to a Non-TradingView Chart
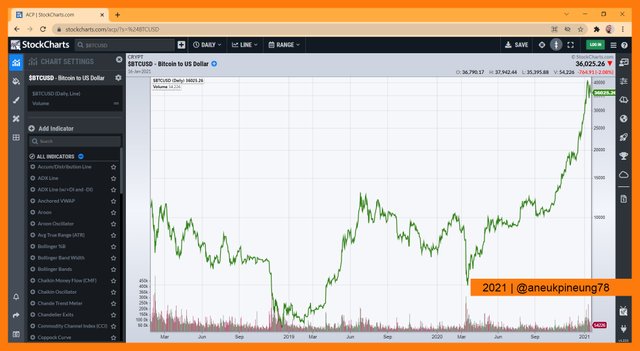
For this task I used the BTCUSD on daily timeframe chart from StockChart.
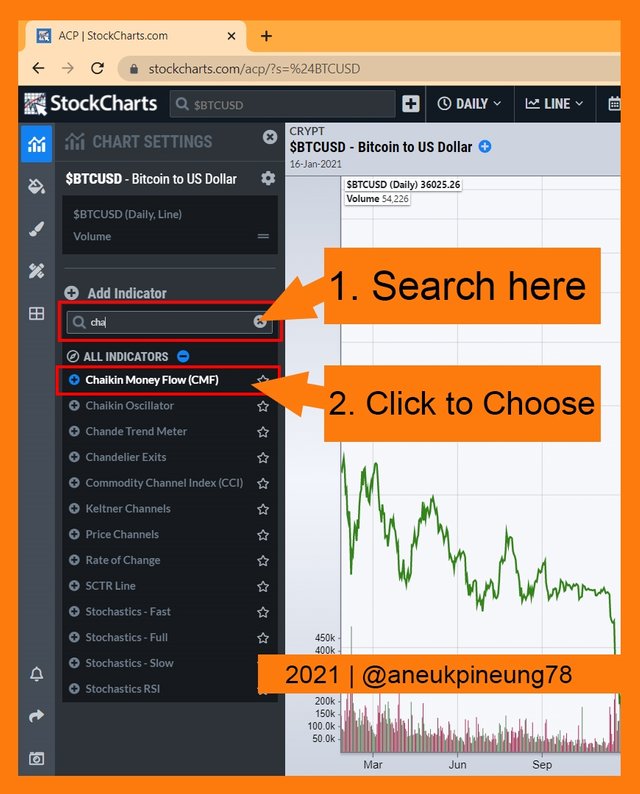
The left pane of the window contained an Add Indicator segment which was equipped with a search box to help users. I typed a keyword into the search box, and selected it in the list of results that appeared below it.
The CMF Indicator immediately appeared below the chart. The left panel changed to the CMF parameter settings panel.
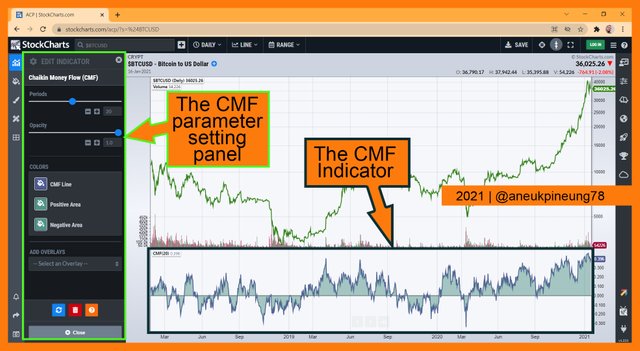
2.2. Modifying CMF Indicator Setting on the Chart
For the market observation purpose, there is only the lookback period to adjust in the CMF indicator. The default lookback period given in the StockChart was 20, I changed it to 21 simply by typing it in to the box (user can also move the slider or hit the + or – button to change the value). On the StockChart version of CMF indicator, the indicator related colors can also be changed for visual purpose.
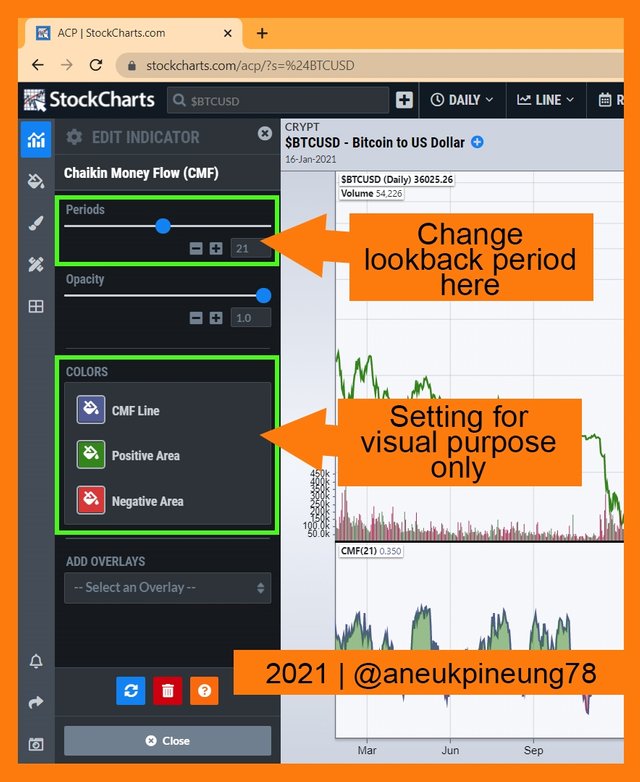
The result is shown in the picture below.
Task 3 - The Indicator’s Role
CMF Indicator is basically a tool to see the movement of money in the market and with it understand what is happening and predict what will happen soon. CMF is an oscillaator type indicator that divides the observation area into two parts: positive and negative. The two observation areas are separated by a median value of 0, while the lowest value is -1 and the highest value is +1.0. Usually the positive area is above the 0, and the negative area is below it.
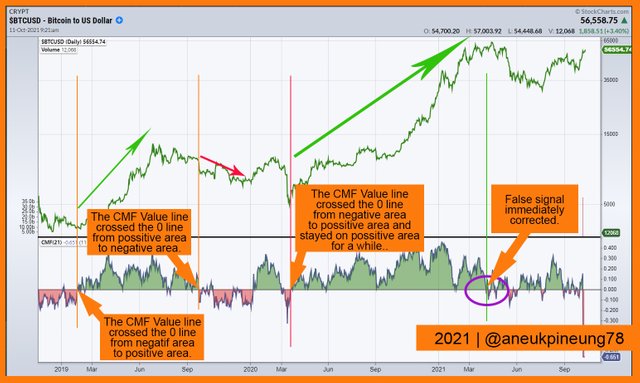
When the CMF value moves to the positive area from negative area, it is an early sign that can be considered the emergence of a positive trend (uptrend). And if the CMF value moves to the negative area, it can be considered a sign of a downtrend. If it stays in one side for some times, it signals the trend continuation.
The chart picture below shows uptrends followed the crosses made by the CMF value line that moved from the negative to positive area. It also shows a downtrend that formed after the signal (the CMF value crossed the 0 line from positive area to negative area. We can also spot a false signal on the chart. This false signal reached -0.1 before it was quickly corrected.
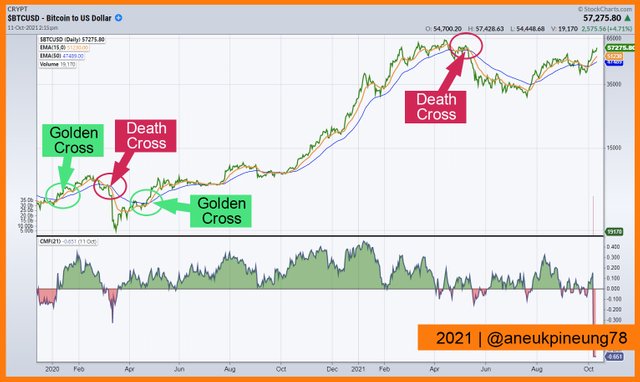
However, users are advised not to act rashly when they see the CMF value line crossing the 0 line, either from the negative area to the positive area or vice versa, because it could be a false signal. That is, the signal that appears should not be responded to prematurely. The image below shows that there has been a technical analysis tool added to the chart, namely the Double Exponential Moving Average (DEMA). You can see in the picture how DEMA confirms a trend change or ignores it.
Task 4 – Trading With CMF Indicator
4.1. In Combination With Double EMA
If using the CMF indicator to trade, then I will combine it with the Double EMA (matching the 15 EMA and 50 EMA is my favorite choice so far).
4.1.1. Entering Bullish Market and When to Leave
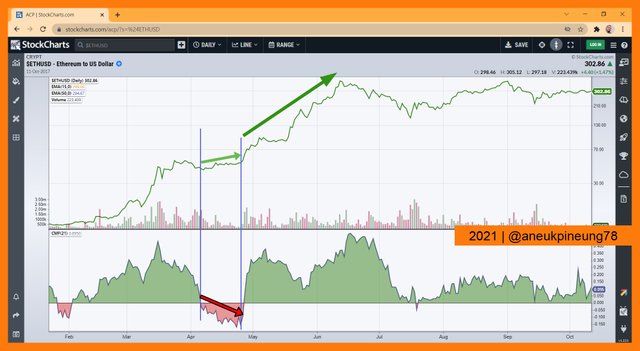
Below is the BTCUSD chart on daily timeframe from stockchart.com. The chart was observed under the combination of 2 technical analysis tools:
- CMF Indicator, set to 21-day lookback period, and
- Double Exponential Moving Average (DEMA), which was a combination of 15-EMA (the orange line) and 50-EMA (blue line), both were calculated from Close price.
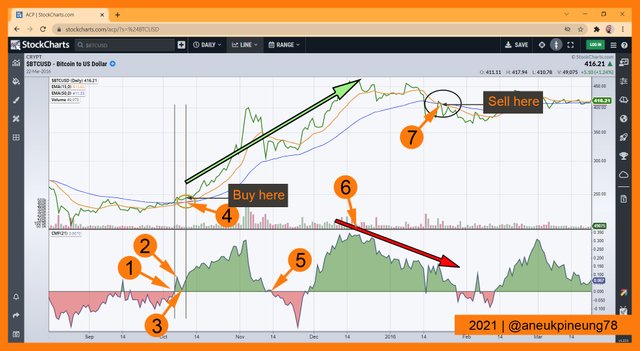
The image above shows:
- Early Possible Signal of Trend Reversal
- The marker (1) indicates that the CMF value line crosses the zero line from the negative to the positive area. This can be interpreted as an early signal of possible bullishness. But this is still very premature, and also the DEMA lines still don't show any signs of a trend change even though they already indicate a possible end of the bearish period.
- The marker (2) shows the CMF value only reached +0.07 then dropped again to +0.02 as indicated by the marker (3).
- Accumulation Phase
- The marker (4) indicates the occurrence of a Golden Cross on the DEMA line when the CMF value line rises again to +0.07. This for me personally is a signal that is strong enough to draw the conclusion that the trend will soon turn bullish. At the time of the Golden Cross this is the best time to buy. It confirms the accumulation phase.
- Marker (5) which shows the occurrence of the zero line crossing by the CMF line from the positive to the negative direction, can be an early signal of a trend change. But even if the figure drops to -0.2, as long as it is not confirmed by the DEMA lines, then it can be confirmed as a false signal, and the accumulation phase continues.
- Distribution Phase
- The marker (6) indicates the distribution phase is likely to happen. I will prepare to release the asset while waiting for the confirmation of trend reversal signal by the DEMA lines.
- Profit Taking
- The marker (7) shows the confirmation of the trend reversal with the formation of the Death Cross by the DEMA lines. I will sell here.
4.1.2. Confirming the Emergence of a Bearish Market
When the market is bullish, traders have the opportunity to enter the market and make profits. But you must always be aware of trend reversal signals so that it is not too late to leave the market.
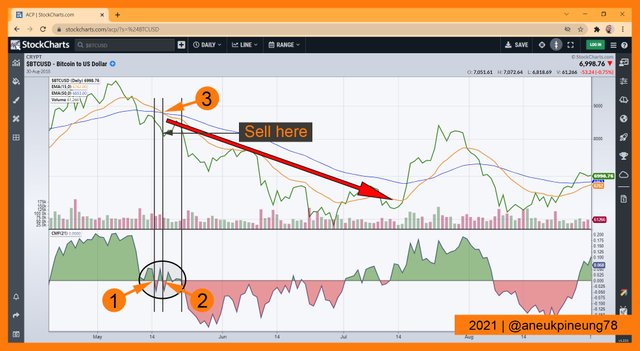
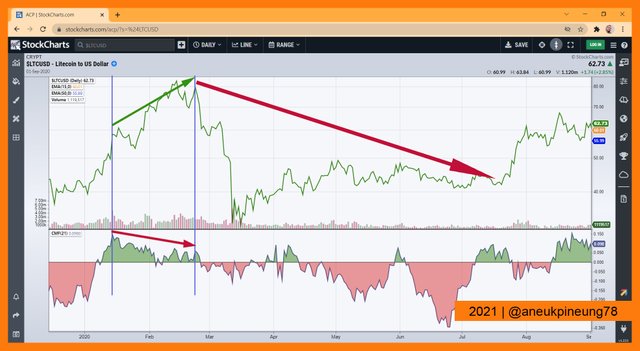
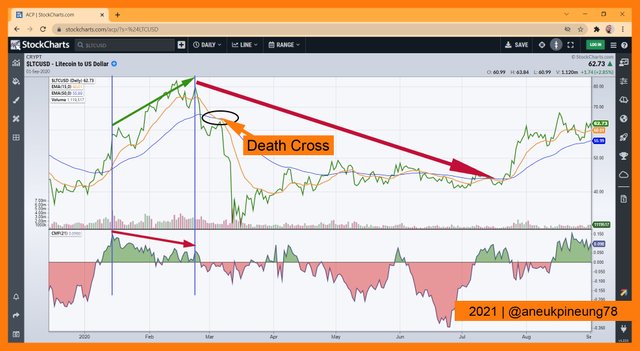
The image above shows:
- The marker (1) shows that at the end of the bullish period, the zero line was cut by the CMF value line. The CMF value reached -0.05 and then cut back the zero line to the positive area to +0.05.
- The marker (2) indicates that the market is forcing it back down, the CMF value line crosses back the zero line towards the negative area. At that time, the DEMA lines confirmed the occurrence of a trend reversal and the market will enter a bearish period, forming a Death Cross, as indicated by marker (3). If I have an asset, then I will release it when it happens, because it is certain that the market will soon become bearish.
4.2. Without Any Combination
I think it will be a little more difficult to get certainty about the state of the market if you use the CMF Indicator without a combination with other tools. It's not impossible, but traders have to wait a little longer to be able to conclude whether a signal is true or a false signal.
I think, in order to take a trend reversal signal as a correct signal, one should wait at least until the CMF value hits +0.2 or -0.2. I think these figures are quite convincing, although I also found that these figures still need to be studied by considering the current trends in the market.
4.2.1. Spotting and Reacting to Bullish Signal
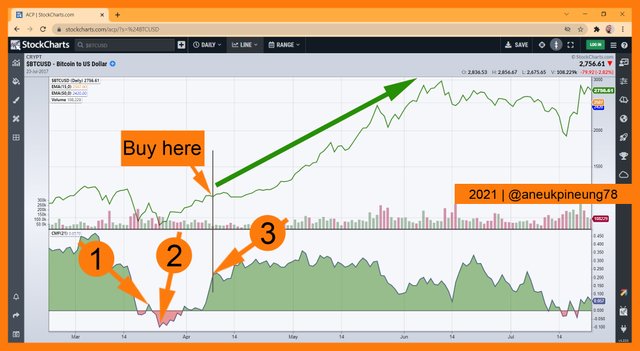
In the image above you can see:
- The marker (1) shows the CMF value at +0.05. To me, this signal is still too premature. I will wait.
- Evidently, a moment later the CMF value fell back into the negative area, as indicated by marker (2), and reached -0.1. The picture above is also proof that the figure -0.1 is also still a very weak signal and traders should wait for a stronger signal.
- The marker (3) indicates the CMF value is at +0.22. For me, this is strong enough to draw the conclusion that the market will experience a bullish period. I will enter the market here.
4.2.2. Here Comes The Bearish Market
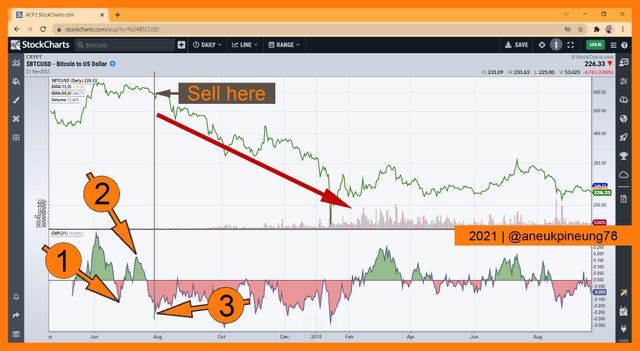
The picture above shows:
- When the CMF value reaches -0.15 as indicated by marker (1), it is not yet strong enough to confirm a downtrend.
- Even when the CMF value is at +0.18, it is still not strong enough to be accepted as a bullish signal.
- When the CMF value reaches -0.25 as indicated by marker (3), then the bearish signal is strong enough and acceptable. If you have assets, this is the best time to sell.
Task 5 - Trading With Divergence Between The CMF And The Price Line
5.1. Price Line Up, CMV Down, on a Bullish Market : A False Signal?
The picture above shows the market chart in a bullish state which was interrupted by a down signal from the CMV indicator, while the price line still shows an increasing trend. CMF value can only go down to -0.15. The market reacted by showing an uptrend continuation.
Any signal can be considered a false signal, as long as it doesn't reach at least -0.2 or +0.2.
5.2. CMF Is Not Crossing the Zero Line But Effectively Changing the Trend
The picture above shows the price line moving with an increasing trend while the CMF value moves in the opposite trend. Interestingly, even during the divergence, the CMF value line crossed the zero line twice briefly, but in general the CMF value line remained in the positive area, and it resulted in a trend reversal towards bearish.
This is in stark contrast to the previous image. Therefore, I tend not to use the CMF indicator without being supported by other analytical tools such as the Double EMA.
Let's look at the chart when it is supported by the Double EMA as shown in the following image.
The image above shows how the Double EMA helps traders realize that a trend reversal is imminent, although it may take a little longer, as the market seems to be trying to maintain a bullish state.
Task 6 - Conclusion
Chaikin Money Flow or CMF is an indicator that helps traders understand how money moves in the market and how it affects the market. With it, traders can get early signals about what will happen in the market, whether it is a trend reversal or continuation.
Yes! CMF does observe accumulation and distribution activities, and is included in the volume analysis group. Basically, CMF is a derivative or development of MACD.
As a volume oscillator, CMF is useful for helping traders detect the appearance of early signals of a trend reversal. But as with other volume oscillators, it is not recommended to use the CMF indicator without combination with other analytical tools. So, the CMF will help alert traders to the possibility of a trend reversal, and the combination tool will confirm whether the signal is quite acceptable as "true" or "false".
Thanks
Thanks Professor @kouba01 for the class of Crypto Trading With Chaikin Money Flow Indicator.
Pictures Sourcing
- The editorial picture was created by me.
- Unless otherwise stated, all another pictures were screenshoots and were edited with Photoshop CS 3.
Sources and Reading Suggestion
- https://currency.com/how-to-read-and-use-the-chaikin-money-flow-trading-indicator;
- https://www.tradingview.com/support/solutions/43000501974-chaikin-money-flow-cmf/;
- https://www.fidelity.com/learning-center/trading-investing/technical-analysis/technical-indicator-guide/cmf;
- https://school.stockcharts.com/doku.php?id=technical_indicators:chaikin_money_flow_cmf;
- https://corporatefinanceinstitute.com/resources/knowledge/trading-investing/chaikin-money-flow-cmf/;
- https://en.wikipedia.org/wiki/Marc_Chaikin;
- https://www.chaikinanalytics.com/about-chaikin/;
- https://www.investopedia.com/articles/active-trading/031914/understanding-chaikin-oscillator.asp;
- https://www.investopedia.com/terms/a/accumulationdistribution.asp;
- https://www.chaikinanalytics.com/media/;


On Twitter : https://twitter.com/aneukpineung78a/status/1449221748646240262.
Hello @aneukpineung78,
Thank you for participating in the 6th Week Crypto Course in its 4th season and for your efforts to complete the suggested tasks, you deserve a Total|10/10 rating, according to the following scale:
My review :
Excellent work, although you sometimes do not comply with what is required, but what you have presented is a good addition to the lesson. As for choosing the best settings, the reasoning behind this is not explained.
Thanks again for your effort, and we look forward to reading your next work.
Sincerely,@kouba01
Thanks, Professor.