Cryptoacademy| season 3 week 6 | vortex indicator by @amritraj
Hello, all here I go throught with the lecture of @asaj about vortex indicator and now i am submitting my homework.
.png)

1) In your own words explain the vortex indicator and how it is calculated?
It is a trend indicator inspired by the natural sciences by two expert analysts Etienne Botes and Douglas Seipman. It was featured in a magazine in 2010. It is based on the earlier work of well-known market analyst J. Welles Wilder. The analyst developed the indicator by monitoring the movement of waves that occurs on the surface of the water. The Vortex indicator consists of two lines that show the movement of the trend. These are the positive (VI +) and negative (VI) leads. It is used by traders to detect the beginning of a trend and confirm the current trend. It is very easy to use.

Source: https://images.app.goo.gl/TEyZL1ZHLxZL1UqMA
If the VI + line crosses the VI line from bottom to top, it indicates that it is bullish. Therefore, a buy signal is formed.
If the VI line intersects the VI+ line from bottom to top, it indicates that the decline has begun. Therefore, a sell signal is formed.
Generally, the blue line (VI +) on the Vortex indicator represents the positive line. The red line represents the negative line.
As shown in the screenshot, lines VI + and VI were crossed multiple times in different ways in different time periods.
Turning on the distance between the VI + and VI lines can provide information on the strength of the trend. The signal to buy or sell is captured by the intersection of lines VI + and VI. The fact that lines VI + and VI are very close indicates that the market is undecided. If we use the Vortex indicator with other indicators, it allows us to obtain more effective results. It is generally recommended for use with the MACD indicator. Because the MACD indicator is also a trend-following indicator.
Calculation of vortex indicator
To do this, we must first calculate the upward and downward movements. Here we move up (VM +) and calculate and subtract the current high price and the previous low price. Here to move down (VM), we calculate the difference between the current low and the previous high. Now we know how to calculate the movement up or down.
Need to calculate the number of cycles. If we choose 50 cycles in the vortex indicator, then the calculation is as follows:
VM50 + = the sum of VM 50 cycles +
VM50 = the sum of VM 50 cycles
Now we need to calculate its true range (TR) . Here we get the TRUE range in three different ways. The current high price minus the current low price The current low price minus the previous close price. The current high price minus the previous closing price.
Now we need to calculate the specified period:
For 50 periods: TR50 = the sum of 50 periods TR
Using the above formula we calculate the specific period of 50 periods.
Now the last step VI + or VI is calculated VI50 + = VM50 + / TR50
VI50 = VM50 / TR50
This formula applies to 50 cycles. If we need other periods, it will change according to it.
Is the vortex indicator reliable? Explain?
I am not sure that this indicator will always give accurate results. But compared with other indicators that use this indicator, we can establish positions based on its buy or sell signals. Is very easy to use. It is not clumsy on the chart. It can be used to understand the current trend and when to reverse. A buy or sell signal is issued before Tred reverses. So we can easily maximize our profits. But it has been introduced recently so further improvements are needed to get accurate results. More research and more updates are needed for this indicator. In normal periods, setting your period to 14 is most effective. Increasing the number of cycles during periods of high market volatility will increase the reliability of the indicator. We can see the signal more clearly on the 1-day chart. When we reduce the time period on the chart, we need to reduce the number of time periods. For example, in a 1-hour chart, we can set the period to 7.
How is the vortex indicator added to a chart and what are the recommended parameters.?
Firstly, visit on tradingview.com chart option here we get indicator option and click on it.

Secondly,
Now, search vortex in the search panel and click on vortex indicator.
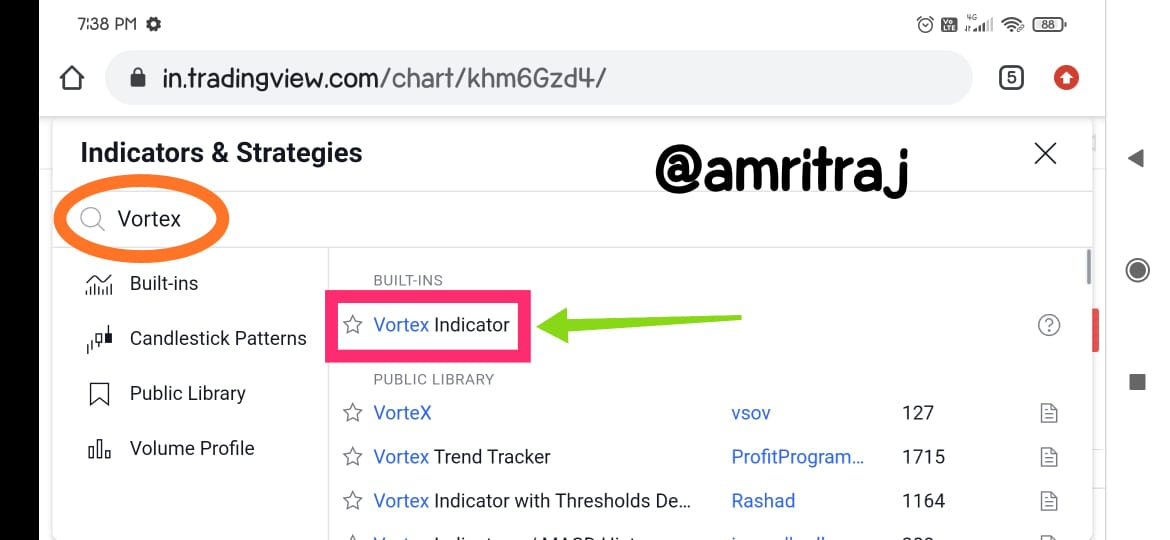
Here we can see these kind of graphics lines available.

Here is a setting option we have to click on that to set the period.

Set timeframe same as chart and length to 14 days.

V1+ will be indicated by blue line and V1- indicated by pink line in styles we can set this and press ok.

Set visibility on defaults and click OK.

Explain in your own words the concept of vortex indicator divergence with examples.
https://images.app.goo.gl/HPZW38ENc5NmM5ARA
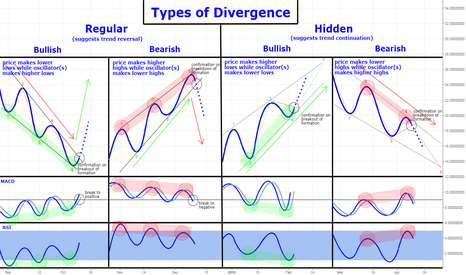
When the market trend is opposite to the indicator trend, it is considered a market deviation. There are two main types of divergence: bullish divergence and bearish divergence. Let us now try to analyze these two divergences by considering the vortex indicator.
Bullish Divergence
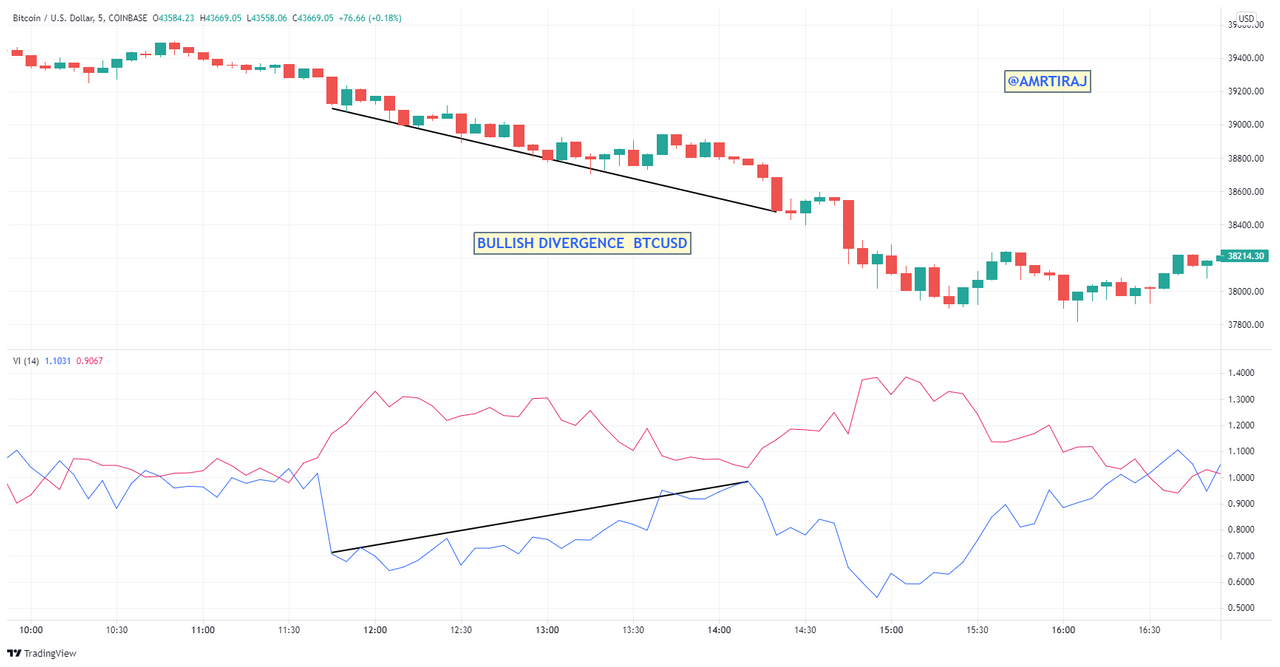
When the market price falls but the indicator shows an uptrend in the market, it is considered an upward divergence. Using the vortex indicator, we can analyze that when the pattern forms a lower low in the market and VI + is at a higher low, it is a sign of bullish divergence. A bullish divergence is a signal to buy an asset and enter the market.
Let's use an example to analyze the bullish divergence in the market.
Bearish Divergence
When the market price rises but the indicator shows a downward trend in the market, it is considered a bearish divergence. Using the vortex indicator, we can analyze that when the pattern in the market goes higher and VI+ goes higher, it is a sign of bearish divergence. A bearish market divergence is a signal to sell an asset and exit the market.
Let us use an example to analyze the market's bearish divergence.

Use the signals of VI to buy and sell any two cryptocurrencies. (Screenshot required)
ETHUSD

DOGEUSD

PROFIT IN BOTH

CONCLUSION
It's time to finish our homework post, where we will discuss the vortex indicator, which is a technical indicator used to analyze trend reversals for perfect market entry and exit points. This indicator can help traders to make big profits over a long period of time. With the vortex indicator, it is strongly recommended to use 14 duration periods and a longer time frame for better market results. We can easily apply the vortex indicator in the trading view. There are two main positive vortex indicator lines and one negative vortex indicator line that show the perfect trend reversal of the market. When the positive vortex line moves upward and the market moves downward, it is a bullish divergence; when the positive vortex line moves downward and the market moves upward, it is a bearish divergence. Finally, we use the vortex indicator to trade crypto assets. The above is my homework post. Thank you very much for the easy-to-understand explanation.
THANK YOU
This content appears to be plagiarised as indicated by @asaj
If you have not already done so, you should head to the newcomers community and complete the newcomer achievement programme. Not only will you earn money through upvotes, you will learn about content etiquette;
Notification to community administrators and moderators:
@steemcurator01 ADMIN
@sapwood MOD Professor[Advanced]
@steemcurator02 MOD
My mistake I apologize @sapwood @steemcurator01 @steemcurator02