Crypto trading using bollinger bands | Season 2 week 8 by @amritraj
Hey everyone hope you all are doing good in this pandemic and staying at homes and stay safe so today I go through with the lecture by @kouba01 about crypto trading using bollinger bands.
So here I am submitted my homework regarding to this topic hope you all will like the information given by me so here it is.
This design is created by me on canva app
QUESTION 1
Define the bollinger bands indicator by explaining calculation method how does it work? What is the best bollinger a band setup?
ANSWER 1
Bollinger band is invented by sir John Bollinger which can help small traders to trade as well as big traders for short and long term trading both. Through this traders can understand that where they have to put RSI after entering in the market. This is indicator which based upon moving averages. This can also help us to analyse the support and resistance. This consists of upper band lower band middle band line is represented as SMA.
This Bollinger band have their own pros and cons like the middle band always provide us more and more information about the trading graph. But bollinger band can not help in trending trades. it moreover only tells about sideways market and useful in ranging market always.
Now let's walk up on the calculation of bollingers band but firstly we see how bollingers bands look like.
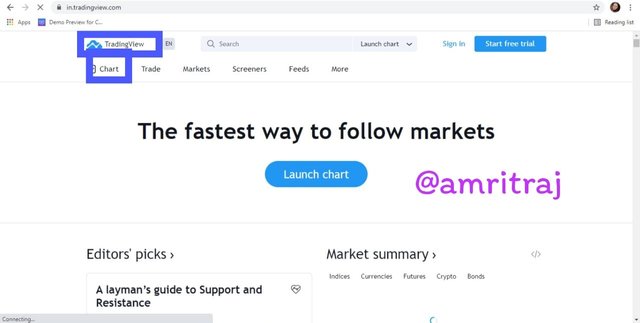
STEP 1
Open tradingview.com and select the chart option from the front page.
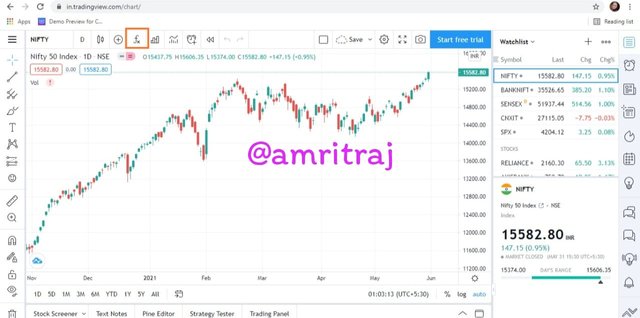
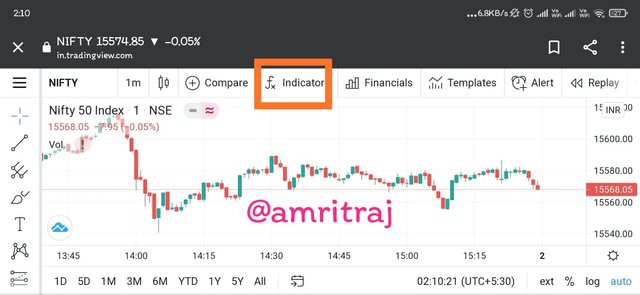
STEP 2
Now select the fx option from the top.
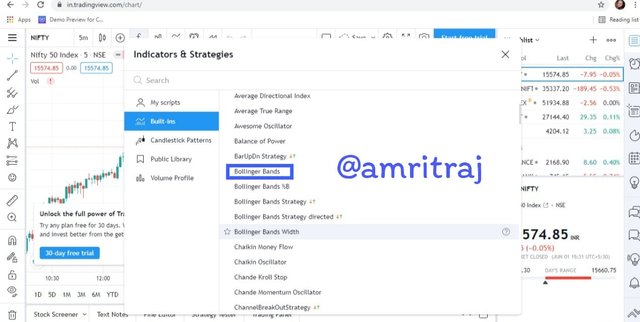
STEP 3
Now select bollinger band option.
STEP 4
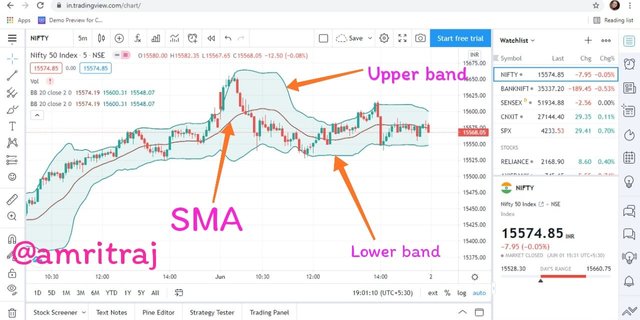
Bollinger band are set up you can see here the upper and lower band and SMA.
CALCULATION OF BOLLINGER BANDS
STEP 1
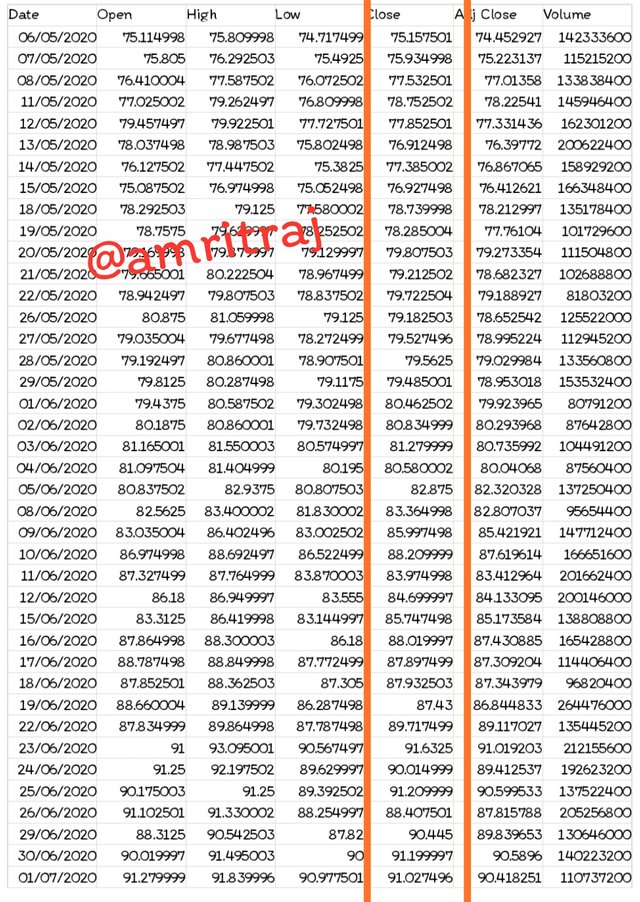
Mean of all the closing prices of 20 days.
STEP 2
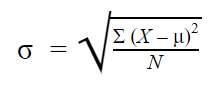
Calculate the standard deviation with the formula
Source :- https://www.scribbr.com/statistics/standard-deviation/
X = Closing price
N = Total no. Of days
μ = Mean
STEP 3
Upper bands = 20 days SMA + ( 20 - standard deviation of price x 2)
Middle bands = 20 days simple moving average
Lower bands = 20 days SMA - ( 20 Day standard deviation price x 2)
WORKING OF BOLLINGER BANDS
There are very useful indicators like volatility Indicators , Overbought and Oversold.
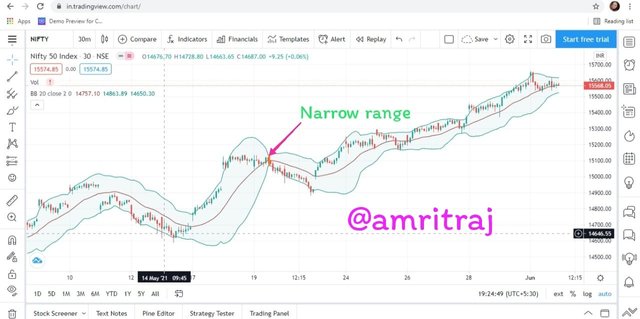
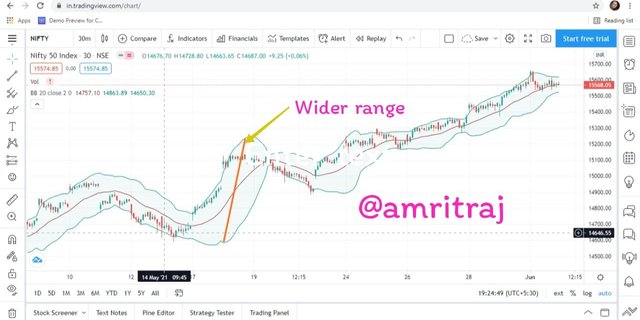
Volatility Indicators means showing rapid changes in the market. When Bollinger band are apart from each other they are high volatile if Bollinger bands are very close to each other then they are less volatile.
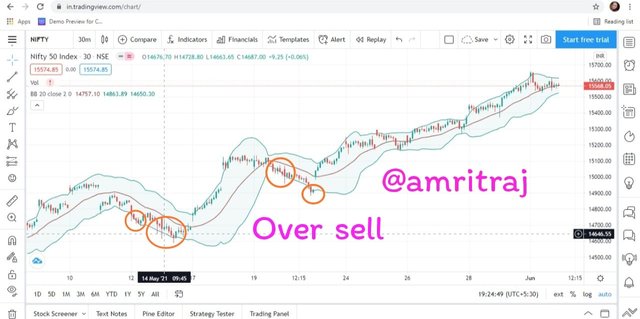
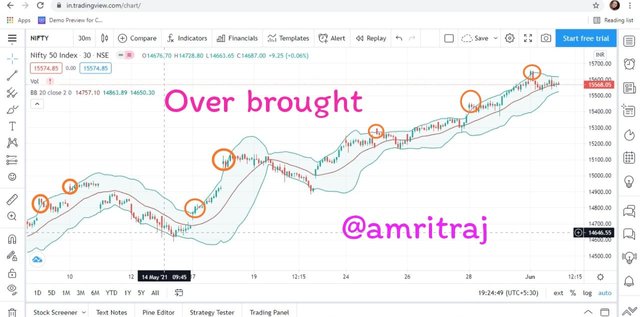
Oversold and overbought when the trade touch or above the upper band is the situation when market is bullish in the trend then it is known as overbought. When the treat touch or down the lower band is the situation when market is bearish and the trend and it's known as oversell.
HOW TO SET BOLLINGER BANDS
Bollinger Bands set up of three bands upper band middle band and lower band it consists of length,standard deviation and time frame.
Length It is the time period for which we are setting of the bollinger bands.
Timeframe It present the time when we seeing the data.
Std dev It is the bandwidth of bollinger bands.
Through this setup our trade study can become very easy.

Question 2
What is a breakout? How do you determine it?
Answer 2
At the point when the development of value diagram for value pattern is out of the locale that is characterized by utilizing markers, obstruction and backing then the circumstance viewed as the Breakout circumstance.
employments of breakout :
At the point when breakout happen subsequent to breaking the help line then broker go for short situation as they realize that cost will show down Trend and they would re be able to purchase that resource again and acquire benefit.
At the point when Breakout happen in the wake of breaking the obstruction line then merchant go for long position and gain over brought benefit.
Break out is viewed as the specialized outline design.
the most effective method to decide it :-
There are three strategies to decide breakout on the off chance that I think about circumstance of this schoolwork :
In typical condition when value talk break backing and obstruction then we can without much of a stretch decide the breakout. Presently we will likewise attempt bollinger groups to decided breakout
At the point when a value graph break the help line all the opposition line then in these two conditions we get a Breakout point where uh ine support line value drop down Trend and in obstruction line cost will climb Trend.
At the point when cost broke help and move beneath lower bollinger band then it is viewed as the Breakout circumstance. It disclose to us market will drop down Trend. After this breakout merchant see a pattern inversion. Market move upturn.
At the point when cost broke opposition and move over the upper bollinger band that it is viewed as the Breakout circumstance. Sell before pattern trun around and move downtrends.
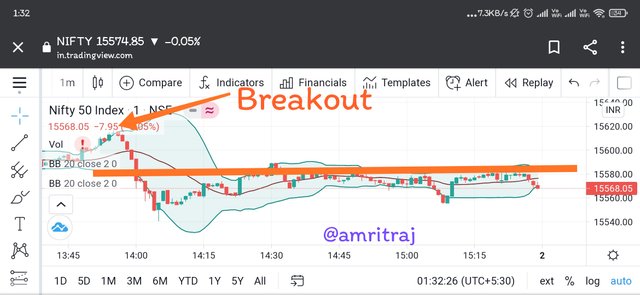
This is how we can understand the breakout in bollinger bands with help of resistance and support.
Question 3
How to use bollinger band with the trending market ?
ANSWER 3
It is particularly simple to utilize bollinger band with moving business sector to ascertain the specific passage and leave point.
Let us individually every technique utilizing bollinger band to enter on the lookout or emerging from market.
UPTREND
At the point when value contacts the upper band and move up with the moving business sector the market is viewed as in the bullish period of the market. Yet, merchant should comprehend that it is a not amazing selling circumstance.
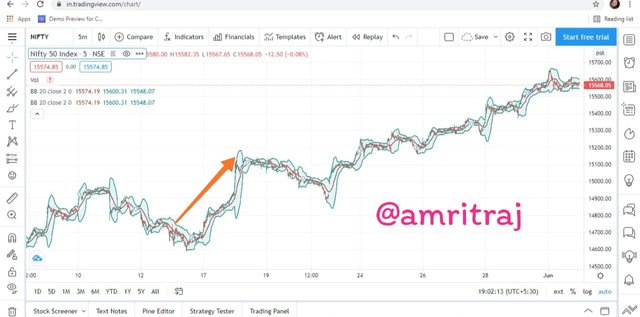
Fruitful bullish Trend
At the point when value contacts support from the center band and push toward upper band then this functioning circumstance is viewed as the fruitful bullish Trend and the ideal purpose of purchasing security when value make support at center band.
DOWNTREND
At the point when value contacts the lower band and move descending with the moving business sector. The market is viewed as in bearish period of the market. However, merchant should comprehend that it's anything but an ideal purchasing circumstance.
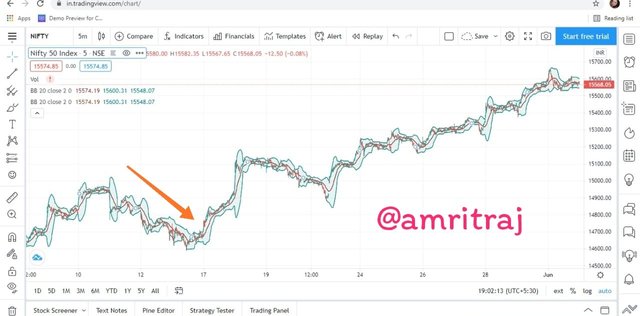
Fruitful bearish Trend
At the point when value take obstruction from the center band and drop down towards lower band then the present circumstance is viewed as fruitful bearish Trend. It is an ideal opportunity to sell the protections when value contacts obstruction of center band.
Question 4
What is the best indicator to use with the bollinger band to make our trade more meaningful .
Answer 4
The best marker that I will like to use with the bollinger band to make our exchange more significant is RSI.
We as a whole realize that few out of every odd pointer is totally awesome however with utilization of other marker and examination of both pointer will give an ideal section and leave point in the market with diminishing misfortunes.
BOLLINGER BANDS WITH RSI
Dealer utilize a procedure that market in bollinger band when hit upper band then it is a leave point for selling point. Also, when market hit lower point then it is section point or purchasing point. However, when we utilize an RSI with bollinger band and RSI tell about resistance and support.It is very helpful in reversal trade also.
STEP 1
Go on tradingview.com and select the chart then click on fx from the top.
STEP 2
Serch and Select RSI from the serch option.
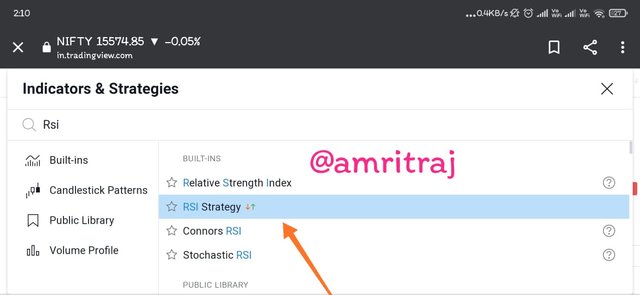
STEP 3
This is the setup of Bollinger bands and RSI together
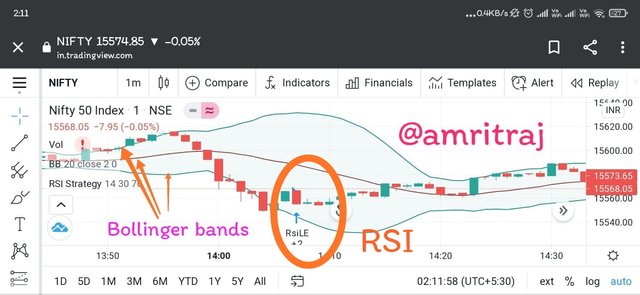
So, this combination gives the perfect timing to the traders for entering and exit from the market by providing much profit.
Hence, I loved the combination of RSI and BOLLINGERS BAND personally.
QUESTION 5
What timeframe does the bollinger band work best on? And why ?
ANSWER 5
Time span is characterized as time which is utilized to finish an undertaking in a given term. For instance we can require 15 secondsto 30 days in stock value diagrams.
Time period consistently rely upon exchanging examination and exploration style . There are a wide range of exchanging techniques dealer use. In bollinger groups we can see the three distinct circumstances or I can say exchanging methodologies which we can take diverse time spans.
ONE day trade
In the event that you are an intraday merchant and close situations at shutting market time then you should utilize the time period of 5 minutes to 10 minutes.
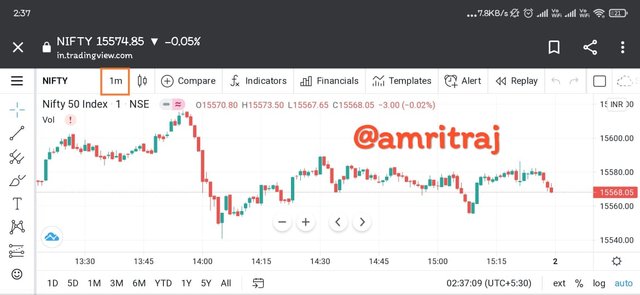
It will assist you with knowing unpredictability on the lookout and give you the ideal section point.
Brief period of time in short exchanging give precision and benefit to the merchant.
So in the event that you are utilizing bollinger band in intraday exchanging, ideally use in minutes time span.
Days trade
Assuming you are standing firm on your footing for 2-4 days, I will prescribe you to utilize one hour time span during investigation.
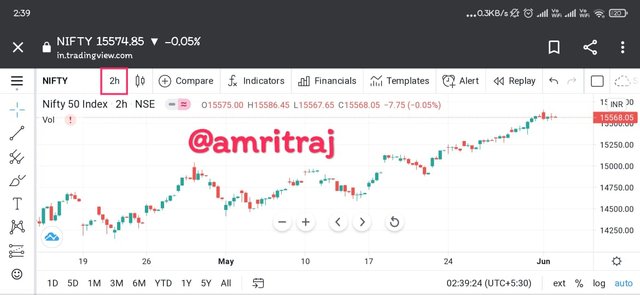
Position holder consistently need to check market pattern obstruction and backing.
As they are holding for quite a long time so for more exactness and benefit they generally favor long or medium time span.
This time period additionally give amazing overbought and oversold condition for the merchant.
Additionally 1 hour time period in bollinger band give us best lower band and upper band candles.
Weeks trade
In the event that you are a drawn out dealer and hold protections for a significant stretch of time then you should incline toward every day outline time period to examination the pattern.
Long haul holders consistently incline toward long time span in view of little candle size.
This time period give High precision and furthermore beneficial exchange for long haul clients.
In such time span it is not difficult to decide bullish and bearish Trend.
It is not difficult to decide obstruction, support and overbought oversold conditions.
QUESTION 6
Review the chart of any pair and present the various signal giving by the indicator bollinger band .
ANSWER 6
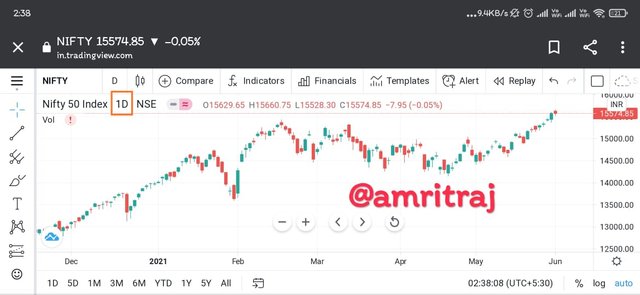
Let see the currency pair usdt/usd in the one day timeframe. Lets put bollinger bands on the 1 day trade and review the trend.
Firstly, we will apply Bollinger bands to the trade chart this show us the upper band , lower band , SMA of the currency.
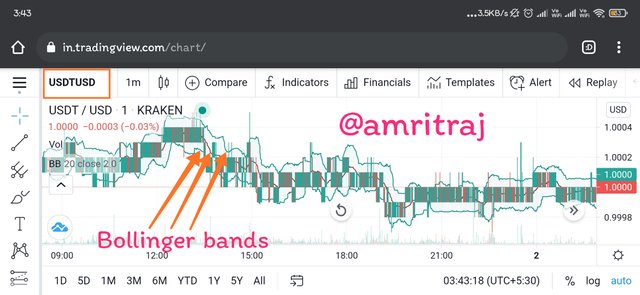
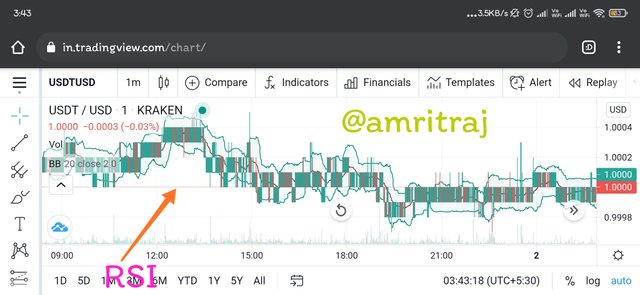
Secondly, RSI with bollinger bands the combination of both will enhance the power if traders to trade and earn profit so with bollinger bands we put RSI also.
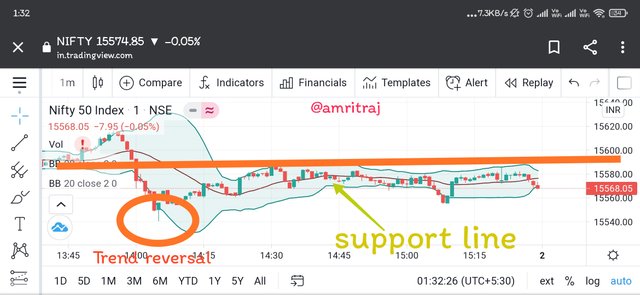
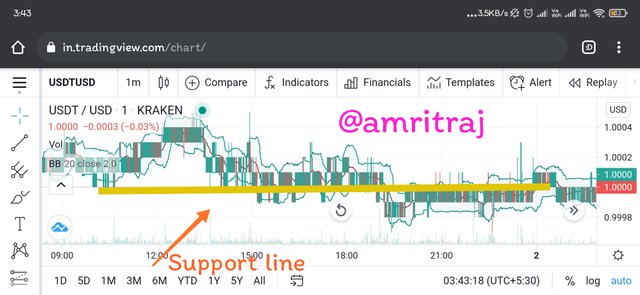
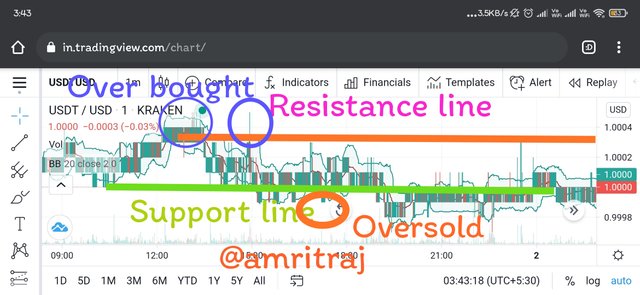
Thirdly, We have a support line in the graph which is mandatory to mark when we about to trade and see the trend of the market. Which show us the max. downtrend of the market.
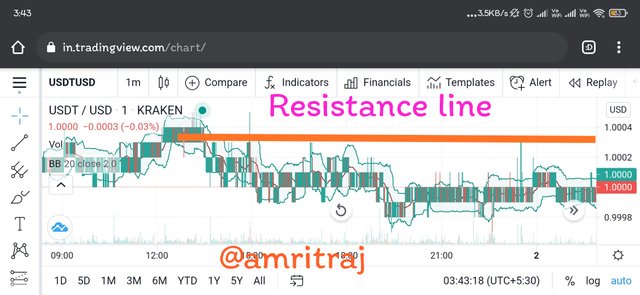
Fourthly, We have a resistance line in a chart which shows us the max. Uptrend of the trade.
Fifthly, Oversell and overbought in the particular currency. The trade is 2 times overbought and 1 time oversold.
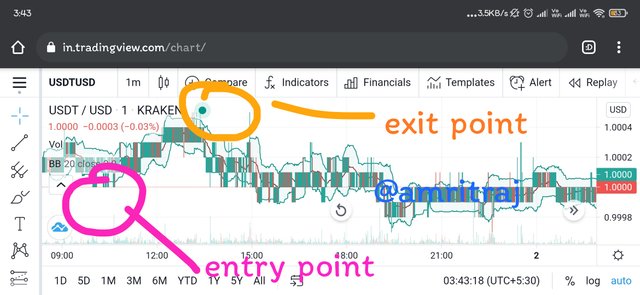
Sixthly, Entry and exit points in the market according to RSI and Bolling bands.
CONCLUSION
So now we are finishing our homework. Here we discuss Bollinger Bands, which is a technical indicator used to analyze price trends. You can also encounter oversold and oversold conditions, market fluctuations, etc. It consists of the upper band and the lower band of SMA 20. Then we move on to its calculation and look at the calculated value. Bollinger Bands use different styles of trading in the trending markets that we have discussed. RSI is one of the most suitable indicators that can be used with Bollinger Bands to obtain high precision and eliminate false reversal trend signals. If traders are trading long, they should choose daily charts for their analysis and research. Thank you very much profesor @kouba01 for your wonderful speech.
NOTE :- ALL SCREENSHOTS ARE TAKEN FROM TRADINGVIEW.COM
Hi @amritraj
Thanks for participating in the Steemit Crypto Academy
Feedback
This was poorly done. Your explanations are not clear. I found lots of trouble in understanding the various statements put across in your work. Endeavour to go through your work and make it readable by rectifying any typing errors in it. The screenshots you provided were also not clear.
Homework task
3.5
Then can you please explain me how to explain i put my all efforts in this reserch i reserch about 1 day and i dont think so it is that much bad that i am failing in this So please explain me how to explain and yes @kouba01 i want your attention on this. Please thank you
@kouba01 please pay attention i review my homework this is like everyone else explained and got 6-7 marks and i have only 3.5 how can it be possible @kouba01 i want you to check this
Ok, I will discuss that with my colleague soon !!
Ok professor please see it i don't think so this is a failure assignment.
@kouba01 please pay attention