Steemit Crypto Academy | Course 5 By @stream4u | All About SuperTrend Indicator.
Greetings @stream4u, thanks again for another great class. Before starting I would like to tell you about my personal experience with your classes. In which I must be honest, during the first reading it is often difficult for me to assimilate the new knowledge and relate it to what I have learned, however as I re-read the content it becomes easier and easier to understand, until I get to the point where it is almost obvious.
So thank you for your recommendation to read the post up to 2 or 3 times ... in my case 4 hahaha. I really believe that this is the only way that knowledge is fixed in our minds.
Let's get started
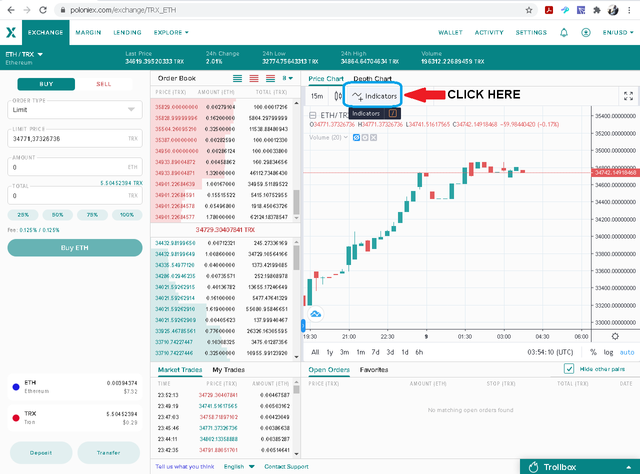 1-First of all, in the options panel of the chart, Select Indicators.
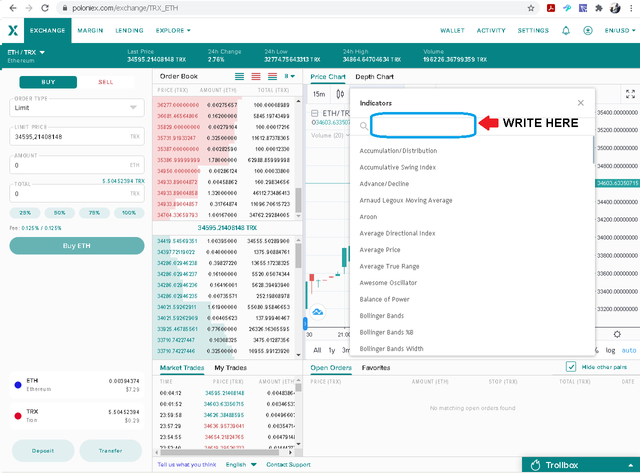 2- When the window with the list of indicators is displayed, we can search for Supertrend in the list, or simply write “supertrend” in the search space. Once we have located and selected our option, we close the displayed window.
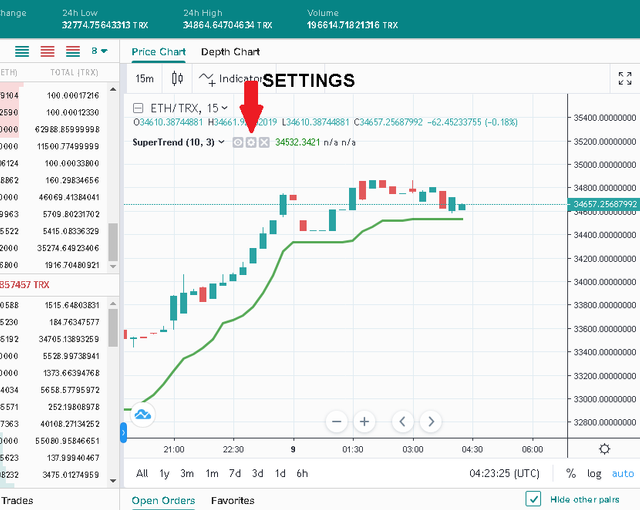 3- When closing the window we will realize that the supertrend line will appear superimposed on our chart. Now is the time to configure the parameters or settings. Click on this symbol.
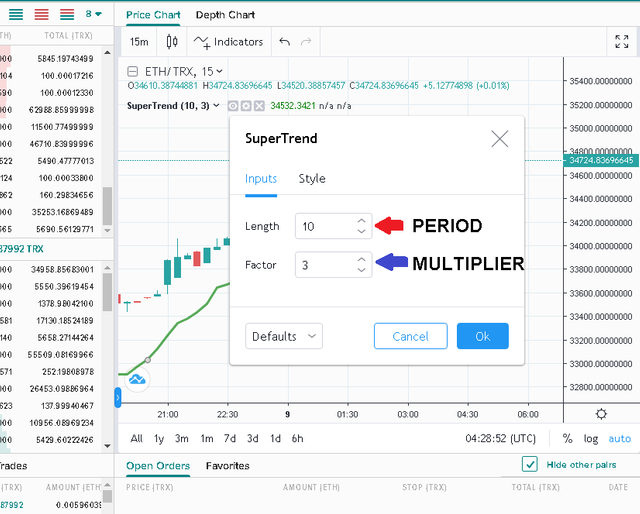 4-The SuperTrend Indicator is based on two parameters or settings: the PERIOD and the MULTIPLIER, and they are usually set in the following values: number of periods: 10 and multiplier: 3.
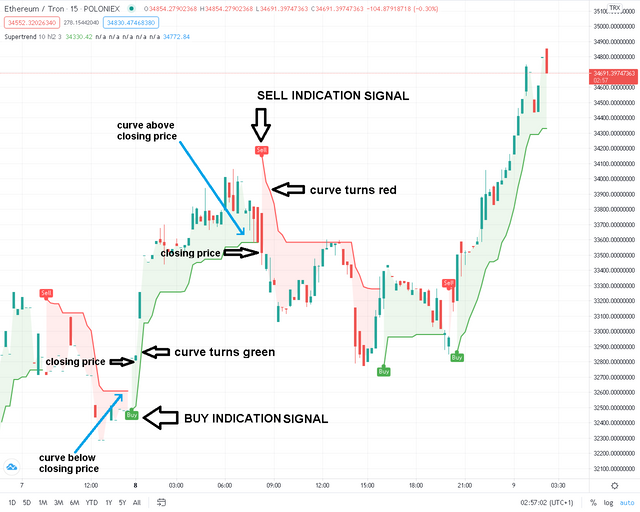 SuperTrend Indications. ETH / TRX Chart Taken from Tradingview on March 8th, 2021. Edited by me.
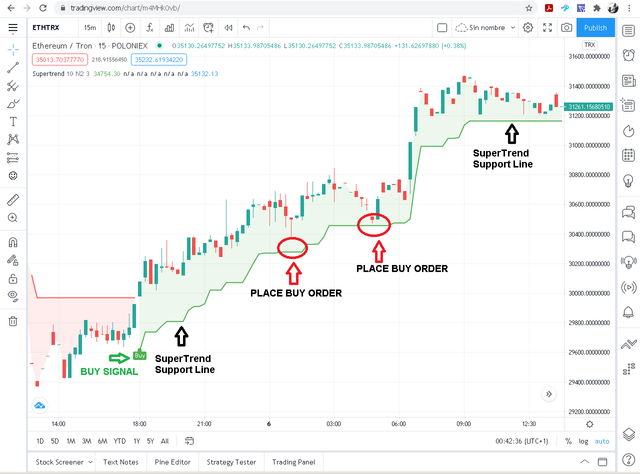 When to place a Buy order . ETH / TRX Chart from March 6th, Taken from Tradingview on March 9th, 2021. Edited by me.
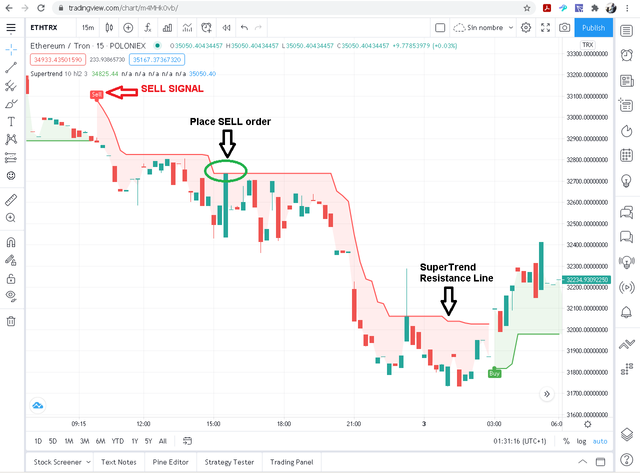 When to place a Sell order . ETH / TRX Chart from March 2nd, Taken from Tradingview on March 9th, 2021. Edited by me.
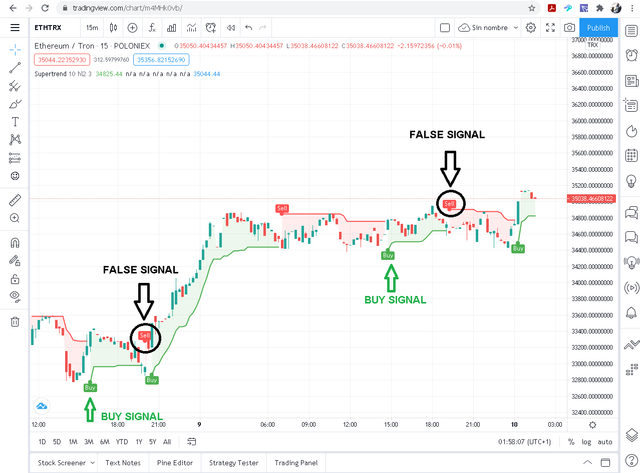 False Signals . ETH / TRX Chart Taken from Tradingview on March 9th, 2021. Edited by me.
 StopLoss in the presence of False Signals . ETH / TRX Chart Taken from Tradingview on March 9th, 2021. Edited by me.
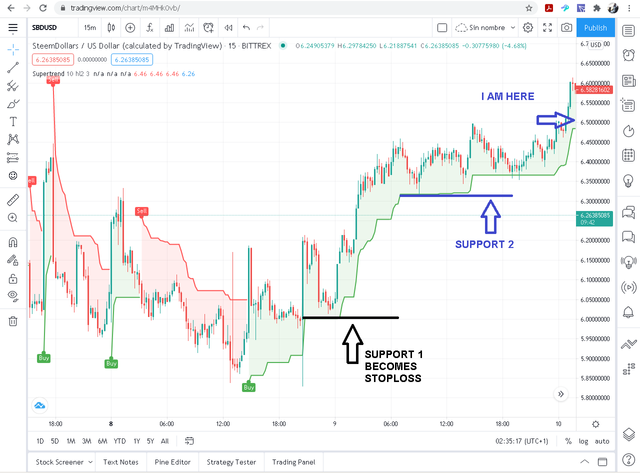 Another case of StopLoss . SBD/ USD Chart Taken from Tradingview on March 9th, 2021. Edited by me.
Q1. What Is A SuperTrend Indicator?
1.The SuperTrend Indicator, as its name indicates, is a trend or tendency indicator that is expressed by means of a Line that is superimposed over the candle chart which can be located both above or below the asset prices, indicating levels of support and resistance. Additionally, this indicator provides visual signals for selling and buying. The SuperTrend Indicator focuses on prices and its location indicates the current trend. For example, if the SuperTrend line is located above the asset prices, it turns red, indicating that we are in the presence of a downtrend. If, on the other hand, the SuperTrend line is located below the asset prices, it turns green, and indicates that we are in the presence of an uptrend.Q2. Show how to set SuperTrend on Chart and what are its settings need to configure.
2. Due to in class, how to set the SuperTrend Indicator was taught in Tradingview, I have decided to do this work in Poloniex. The following Screenshots were taken from Poloniex on March 9, 2021, from the ETH / TRX chart, 15min. Edited by me. 1-First of all, in the options panel of the chart, Select Indicators.
 2- When the window with the list of indicators is displayed, we can search for Supertrend in the list, or simply write “supertrend” in the search space. Once we have located and selected our option, we close the displayed window.
 3- When closing the window we will realize that the supertrend line will appear superimposed on our chart. Now is the time to configure the parameters or settings. Click on this symbol.
 4-The SuperTrend Indicator is based on two parameters or settings: the PERIOD and the MULTIPLIER, and they are usually set in the following values: number of periods: 10 and multiplier: 3.
The second parameter can be lowered if you want the indicator to react more quickly to price changes, but it can generate more false signals.
In general, the default settings work quite well, other configurations may generate inaccurate signals.Q3. How SuperTrend Shows Buy-Sell Indications?
3. As I mentioned earlier, the behavior of this indicator is divided into two cases, for an uptrend and another for a downtrend, showing indications or signals for buying or selling respectively. SuperTrend Indications. ETH / TRX Chart Taken from Tradingview on March 8th, 2021. Edited by me.
In the case of an uptrend; When the indicators curve slides below the closing price of the asset, the indicators color (Line) turns GREEN (as does the area under the curve depending on the platform used). In addition, a BUY signal is generated.
In the case of a downtrend; When the indicator is above the closing price of the asset, the indicators color (Line) turns RED (as does the area under the curve depending on the platform used). In addition, a SELL signal is generated.Q4. When We can place a Buy Trade with the help of SuperTrend Indicator?
4. Contrary to what you might think, it is not recommended to place the buy order just at the moment when the indicator shows you the BUY signal, and the curve turns green and is placed below the price chart. Instead, we must be patient and wait for asset prices to develop their trend. It is done in this way to avoid possible errors caused by false signals. Once the first bullish phase of prices is overcome, at some point the curve will decelerate its upward movement and the asset price will begin to fall and approach the SuperTrend line. In this scenario the SuperTrend line works as a reliable Support that does not allow the price to fall further but will make it bounce upwards. When to place a Buy order . ETH / TRX Chart from March 6th, Taken from Tradingview on March 9th, 2021. Edited by me.
Q5. When we can place exit/square off, sell order with the help of SuperTrend Indicator?
5. For the opposite case the same principle applies. Once the indicator shows us the SELL signal and the curve is positioned over the asset's price candles, we must be patient for the trend to develop. Once the first phase of price downtrend is overcome, at some point the fall of the SuperTrend curve will slow down and the asset price will experience a rise approaching the Indicator's Line. In this scenario the Supertrend line works as a reliable Resistance that does not allow the price to rise further but will make it bounce down. When to place a Sell order . ETH / TRX Chart from March 2nd, Taken from Tradingview on March 9th, 2021. Edited by me.
Q6. How false indications look in SuperTrend Indicator?
6. The way to detect a false indication or a false signal is when the SuperTrend shows BUY signals followed by SELL signals very quickly or in a short period of time. The opposite case also applies; when the Supertrend shows a SELL signal followed by a BUY signal in a very short period of time. False Signals . ETH / TRX Chart Taken from Tradingview on March 9th, 2021. Edited by me.
Q7. According to your view what Stoploss you will suggest?
7.In the first place, I would review the Supertrend chart and the history of its Support Line, choosing the last two that have not been affected by a false sell signal.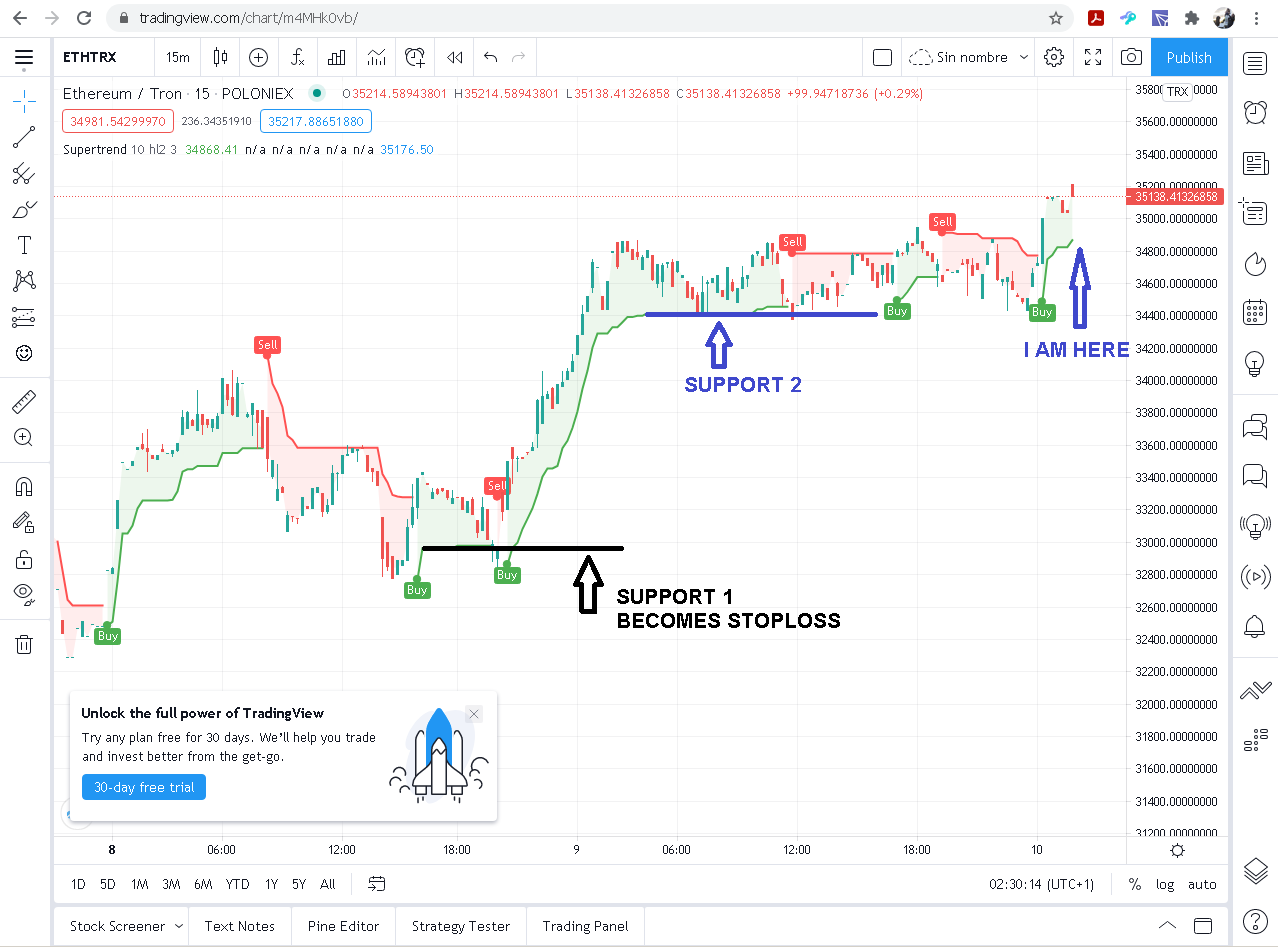 StopLoss in the presence of False Signals . ETH / TRX Chart Taken from Tradingview on March 9th, 2021. Edited by me.
 Another case of StopLoss . SBD/ USD Chart Taken from Tradingview on March 9th, 2021. Edited by me.
Hi @allbert
Thank you for joining Steemit Crypto Academy and participated in the Homework Task 5.
Your Homework task 5 verification has been done by @Stream4u.
Good to share your thoughts. According to my experience, I will say, SuperTrend can help you in short term and in long term too.
Thank You.
@stream4u
Crypto Professors : Steemit Crypto Academy
Thanks for your feedback. I'll keep it un mind. And thank You for the clarification about long-term accuracy. I did'nt see it that way till now.
Hello again @stream4u, you're right. I checked this chart out this morning and found this (1D Supertrend). For sure it had the wrong parameters configured.
Glad to see you noticed that. Great observation.
Actually, I wanted to tell you at the same time while checking this, however, the information about SuperTrend was right so I forgot to tell you.
It seems you selected another SuperTrend as settings quite look different, below is the right which I use and also in my course post.
This right?