Steemit Crypto Academy | Course 4 By @stream4u | Support <----> Resistance | What is Technical Indicator? | Overview Of TradingView | 200 Moving Average.
Hello @stream4u, thanks again for the wonderful explanation and for the effort you put into your classes. For me it is an honor to learn from you. Here are my answers.
 Resistance <----> Support. SBD / USD 15min Chart; Taken from Tradingview, March 2nd 2021. Edited by me.
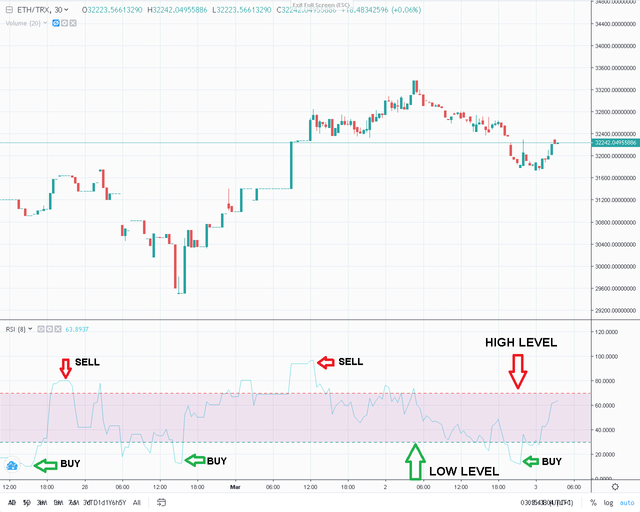 Technical Indicator Example: RSI / Relative Strength Index (lenght:8). ETH / TRX Chart; Taken from Poloniex, March 2nd 2021. Edited by me.
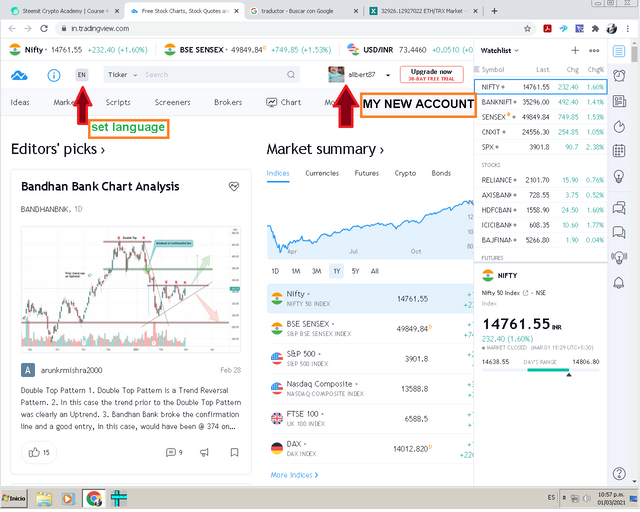
First Aproach. Picture Taken from Tradingview, March 1st 2021. Edited by me.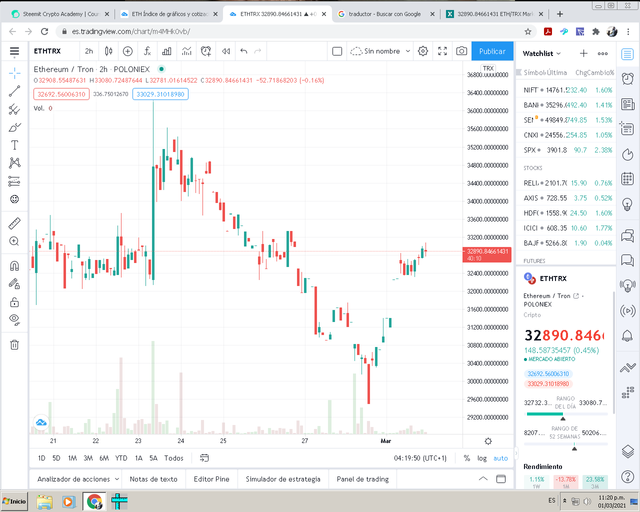 ETH / TRX Chart, Taken from Tradingview, March 1st 2021. Edited by me.
 Some issues, ETH / TRX Chart with MA 50/200 Indicator. Taken from Tradingview, March 1st 2021. Edited by me.
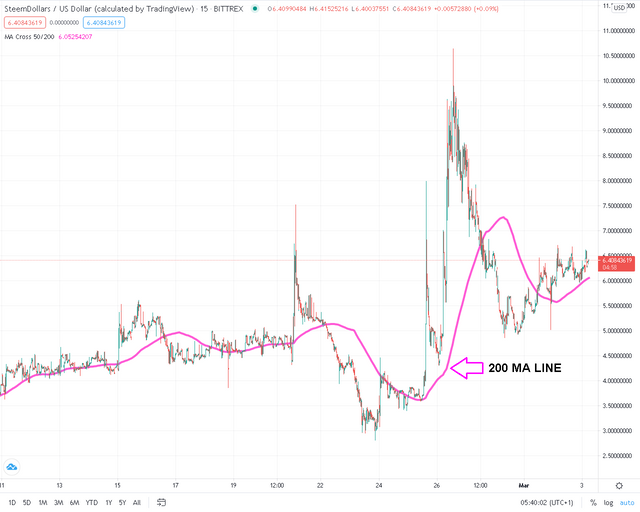 SBD / USD Chart with MA 200 Indicator. Taken from Tradingview, March 3rd 2021. Edited by me.
 Different price reactions towards 200 Moving Average, ETH / TRX Chart with MA 200 Indicator. Taken from Poloniex, March 3rd 2021. Edited by me.
Q1. What Is The Meaning Of Support Can Become Resistance & Resistance Become Support, When and Where set Buy trade, Chart Example?
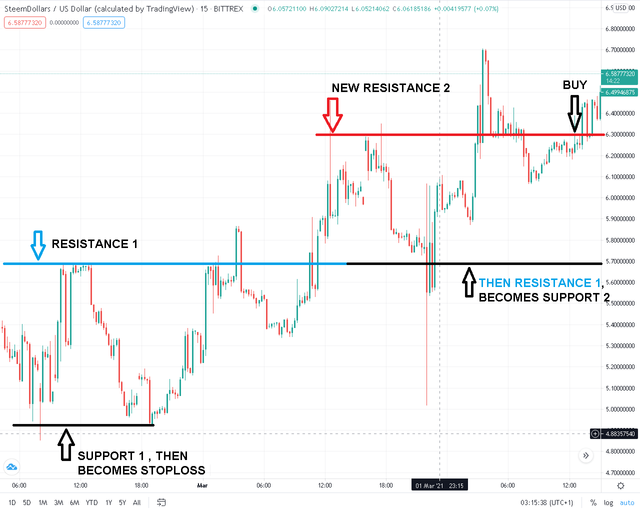
1. Market is changing continually and behaves like a living organism, it is not static. For this reason we have to be aware that the Support and Resistance Levels will change as the trends in asset prices move. These levels will vary their function, however they will continue to be levels that we will take as references. As usual, we start with a well-defined original support and resistance levels. In the case of an upward trend in the price where the resistance is exceeded, we must first extend the resistance line and wait. If the price of the asset continues to rise for a couple of days, we will then notice that the price of the asset will tend to fall to the level of resistance. Resistance <----> Support. SBD / USD 15min Chart; Taken from Tradingview, March 2nd 2021. Edited by me.
Q2. What Is A Technical Indicator? (You can explore it as much as you can, like explain its role, show anyone technical indicator from your chart and name of that Indicator.?)
2.A Technical Indicator is a visual pattern that we add on the chart and that provides us with additional information on trends previously studied under mathematical models, thus giving us a fairly reliable forecast of the asset price and allowing us to more clearly visualize the ideal times to buy or sell. These indicators or mathematical models have been previously developed by experts in the field who have been studying market trends for some time and although they are not infallible, they are an extra help in our analysis. Technical Indicator Example: RSI / Relative Strength Index (lenght:8). ETH / TRX Chart; Taken from Poloniex, March 2nd 2021. Edited by me.
Q3. Provide your view and explore TradingView.
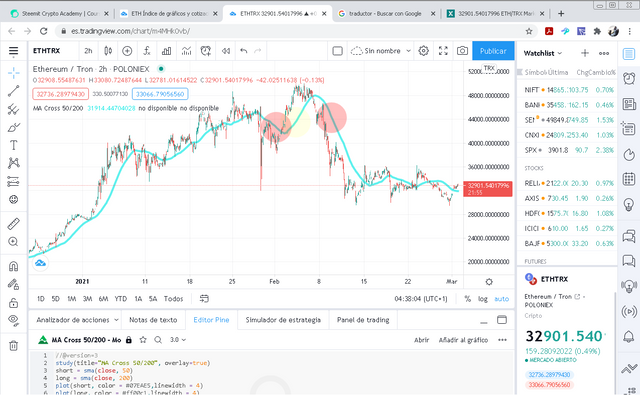
3.What I could observe exploring Tradingview is that it is very intuitive, which is the first thing that attracts me in an application, software, game, etc. In fact, I was able to quickly create a totally free account and almost immediately start viewing charts of different cryptocurrencies.
First Aproach. Picture Taken from Tradingview, March 1st 2021. Edited by me.
 ETH / TRX Chart, Taken from Tradingview, March 1st 2021. Edited by me.
 Some issues, ETH / TRX Chart with MA 50/200 Indicator. Taken from Tradingview, March 1st 2021. Edited by me.
Q4. What is 200 Moving Average, how and when we can trade/invest with the help of 200 Moving Average? Show different price reactions towards 200 Moving Average
200 Moving Average is an indicator which shows us the average closing value (of the last 200 days) of our asset and displays it as a line. The way the candlesticks react or behave around this line will give us an indication of how prices will behave in the future. It tells us when an asset is in an upward or downward trend, so we can decide how to plan the operation. For example, if the price of the asset is above the 200 MA line and remains above it, then it is concluded that the upward trend of the asset will continue and it is recommended at that point to make our entry. SBD / USD Chart with MA 200 Indicator. Taken from Tradingview, March 3rd 2021. Edited by me.
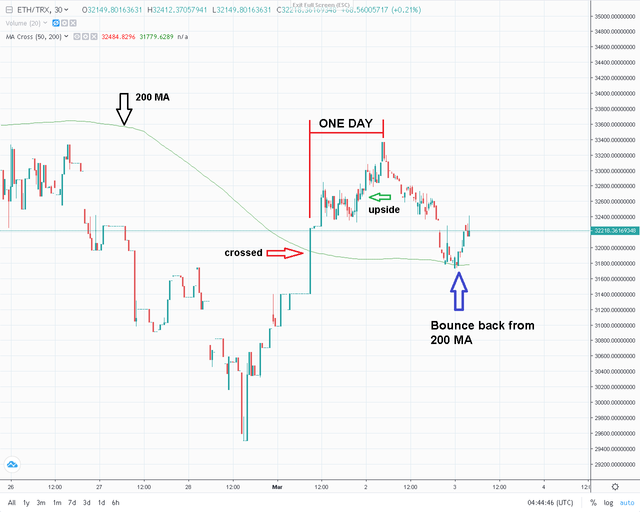
 Different price reactions towards 200 Moving Average, ETH / TRX Chart with MA 200 Indicator. Taken from Poloniex, March 3rd 2021. Edited by me.
Hi @allbert
Thank you for joining Steemit Crypto Academy and participating in the Homework Task 4.
Your Homework task 4 verification has been done by @Stream4u.
Thank You.
@stream4u
Crypto Professors : Steemit Crypto Academy
Thank You very much. I've learned a Lot.