Crypto Academy Week 10 - Homework Post for [@stream4u]. All About Price Forecasting
Hello again @stream4u, I'm happy to resume classes with you. You will be happy to know that I have practiced all the knowledge you shared in season 1. Especially with the crypto DOGE, on which I base today's entire post.
I think I've done very well, increasing my capital from 20$ to 90$, I know it's still very low, but what I really value is the experience I've had in the last weeks.
Let's get started.
 Image edited by me in Powerpoint. Central image taken from: Source
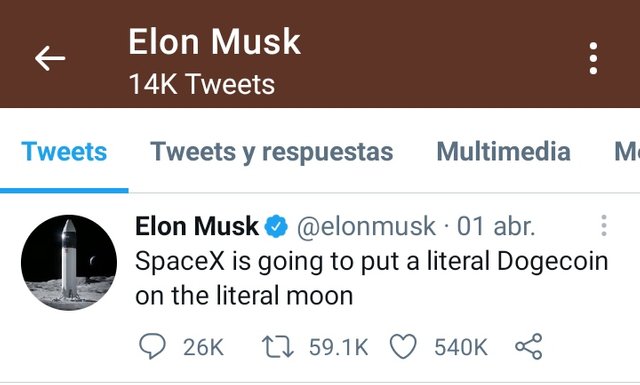 Elon Musk's tweet. Image taken by Twitter. Source
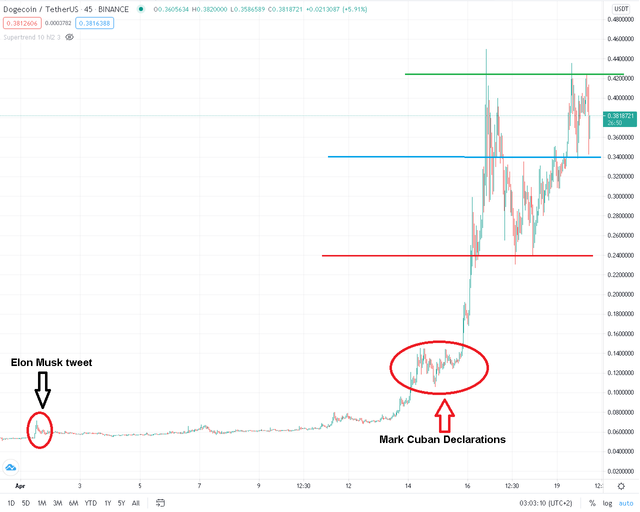 DOGE/USDT chart, 45 minute time frame. Image edited by me, and taken form tradingview.com website. Source
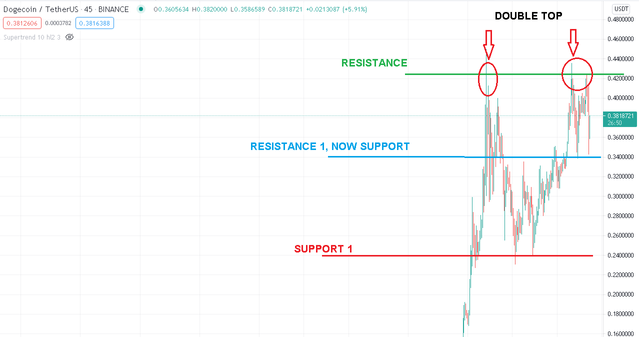 DOGE/USDT chart, 45 minute time frame. Image edited by me, and taken form tradingview.com website. Source
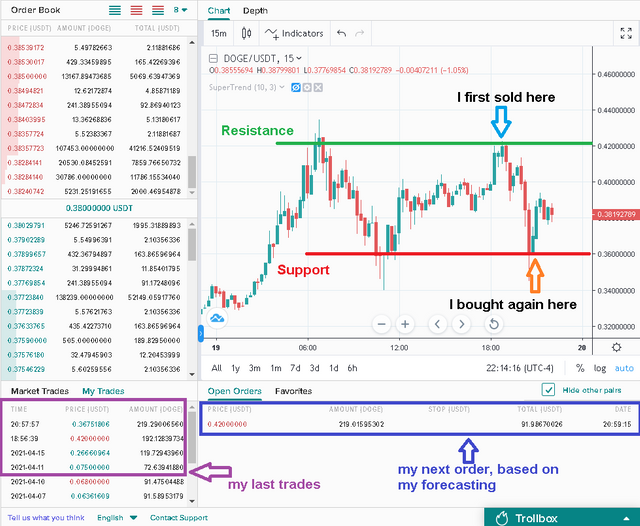 DOGE/USDT chart, 15 minute time frame. Image edited by me, and taken form Poloniex website. Source
Image edited by me in Powerpoint. Central image taken from: SourceQ1. What Is Price Forecasting?
It refers to all those methods that we can use to know the future behavior of the price of an asset. Every time I hear or read the word Forecasting, the Weather Forecast Report comes to mind, and all those poor TV hosts who try to guess what the next day's weather will be like. Most of the time they have a hard time. Because, as our Professor rightly said in class:But no supernatural powers of clairvoyance are needed to make a Price Forecast, but these methods are based on the objective study and detailed analysis of several factors related to the asset; the candlestick chart, the development of the company, and even the public opinion about the asset. All these factors indicate to the investor what decision to make in terms of buying or selling an asset."you are predicting the future." Source
Q2. Discuss on why Price Forecasting is needed?
Without getting too technical, the need to have a good Price Forecast is that it can be the difference between making a big profit or having a big loss, or simply staying static. It is also a fundamental tool to know the future of an asset. This information is valuable for an investor because it allows us to draw investment strategies, minimizing risks. Another reason why the Price Forecast is necessary is that it allows us to maximize our profit opportunities. At this point, I must thank you @stream4u, because in a way you opened my eyes. In my mind was the traditional idea of investing when it was low and just waiting for the price to go up. I see I was making a mistake. In fact last week I made an additional investment in DOGE because of an article I read where Mark Cuban and his NBA team endorsed the currency, Here you can see the article: Source I made my investment and just waited. However, by learning about Price Forecast, I realize that there is more to life than just waiting. Through this method I can maximize my opportunities to enter and exit and therefore increase my profits in a slow, safe, and steady way... and not just depend on a big market upswing, but we can be able through Price Forecast to generate profits in any asset no matter what kind of trend it is in; just knowing the support and resistance prices or in other words, knowing where the current price is and knowing where it will be.Q3. What Methods are best you feel for Price Prediction/Forecasting.
This is a tough question, but I honestly think it depends on several factors. As an engineer (who likes accuracy), I lean towards Technical Analysis, as it is the most accurate of the three. Moreover, from what I have seen in class, it allows us to make several trades during the same trend, thus maximizing our profits. As I see it, the Technical Analysis can be adapted to various time periods (short and long term) depending on how we configure the period parameters of our Chart. The only drawback I see to this method, (and it is not because of the method itself), is that it may be confusing for people who are not educated in this area. It is not for everyone. On the other hand, Fundamental Analysis actually doesn't seem so bad to me, if it is used for long-term investments. If after analyzing the numbers, earnings, and new developments in a company, you realize that they are doing a good job... I can assure you that in the long term that company and that crypto will have to grow. However in the short term maybe this method is not the most convenient. Finally, Sentimental Analysis could be said that can be used for opportunistic investors. As in my case on April 1st. That day I read news about Elon Musk and a tweet of his about DOGE. In my opinion, it was all a joke, but not for the people who automatically invested (I was one of them). Result: the price went up abruptly.Elon Musk's tweet. Image taken by Twitter. SourceQ4. Take any Crypto Asset Chart graph and explain how to do Price Forecasting? OR Take any Crypto Assets Chart graph & as per its current price tell us what will be its future price for next 1 week or 1 month? You can predict for any direction up or down but explain it properly on what basis you have predicted the price.
All right, as I mentioned at the beginning, I took DOGE, so, this is my analysis and my prediction: 1- First I obtain the candlestick chart, and through it, I observe the behavior and the history of the price of the asset. In the case of DOGE, the price was almost the same until April 11, when it started its uptrend. 2- Second, at the top of the chart I draw three lines that will act as supports and resistances. These lines will guide my forecast.DOGE/USDT chart, 45 minute time frame. Image edited by me, and taken form tradingview.com website. SourceDOGE/USDT chart, 45 minute time frame. Image edited by me, and taken form tradingview.com website. Source1 Week forecast:
So based on this analysis, I think the DOGE price will stay between 0.34 and 0.42 at least one or two more days. (days elapsed between the two upper peaks), after that, the price will drop below the blue line of 0.34 and stabilize until the end of the week between 0.24 (new support) and 0.34 (new resistance). Beyond that, I do not feel able to forseen.Extra
I also wanted to add a forecast that I made while I was doing the task. It is a short-term DOGE forecast. During the time I was making this post, I carefully watched the asset price, applying the knowledge I just learned from the class. In that time I was able to forecast the DOGE price between 0.36 (support) and 0.42 (resistance).DOGE/USDT chart, 15 minute time frame. Image edited by me, and taken form Poloniex website. Source
Hi @allbert
Thank you for joining The Steemit Crypto Academy Courses and participated in the Week 10 Homework Task.
Your Week 10 Homework Task verification has been done by @Stream4u, hope you have enjoyed and learned something new.
Thank You.
@stream4u
Crypto Professors : Steemit Crypto Academy
Thank you my Professor, for your suggestion. I'll do it.
Yes I enjoyed. Thank You.