HOMEWORK :How To Read Candlestick Charts In Different Time Frame & Information about Buy-Sell(Support & Resistance) , PROF:@stream4u
In this post i will be expalinining how candle stick works and when and where should one buy a coin and when to sell .
First of all let look at the two type of candle stick and learn how to read them :
1.the Green Candle stick this is also call the bullish candle ,it represent a uptrend movement below is a picture i will use to explain how you read this candle stick .
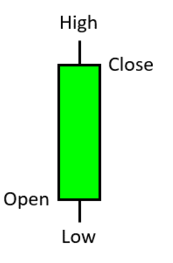
lo0king at the candle it has been labelled with in different part and each of these have a special function .
LOW : It simply indicate the lowest price on the chart where the uptrend at a particular time frame started
HIGH : This represent the highest price recorded by the candle stick beforing the xet to it start to form
-OPEN : This indicate the market open of the day , simply after the candle record it low the bull will push the market forming the candle body so the start of the candle's body is called the body
-CLOSE : This is the price at wich the body of the candle get fully formed and the market closes , after wich the high price is recorded .
- Red Candle Stick : This indicates a down trend and it is also called the bearish candle stick it has same features as the green candle stick , but with a slight difference.
check the image below:
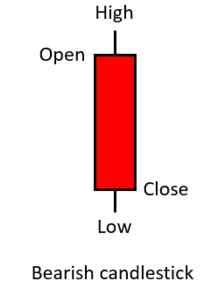
The low and the high of this candle stick has the same meaning but in this the candle stick start at the highest price and fall to the lowest price .
OPEN : here the open is that particular point where the bulls start to pull the make down here the body of the candle stick begings to form.
CLOSE : This price indicate the point where the body of the candle stick has ended and leading to another candle stick to be formed .
There different way of studying the chart on of them is time frame you can cosider a 15min,1hour,a day , a week or a month , this choice depend on the type of trader you are .
i will explain using images the candle stick chart at different time fram and the type of traders it will favor .
THE 15 MIN CHART
This is oftenly use by short traders , they do not delay in the market they take advantage of short profit and exist the market , in this chart every 15 min a new candle stick is formed smetimes it doesnt get to that when a bull wnat to follow a bear , the picture below has a simple explanation as to how they enter the maket and take profit out using the 15min candle stick. and this 15 min chart is showing a trend that is different from whay a 4hours or a day cahrt will show , so one must know the typr of business he/she want to play before selecting a time frame chart.
.png)
If you are the type ike me who will like to study the chart for a longer time clearing all doubt before enetring the market then you need to study the 1 Day ,1week chart before entering the market , in this situation we hold the coin for long time frame before taking profit as explain in the 1Day chart below :
.png)
Unlike the 15min chart here you can see a clearly uptrend , menaig if someone who uses this type of chart entered the market with good technical analyses he/should be in profite by a day time .
AS i mentioned ealier there 3 types of traders we have the
Short term traders : this traders focus much on taking profits faster like within an hour or 4 hours time , they follow a good trend then execute trade .
Long term Traders : this trader hold a coin in the market for long , some dont quite the market for a day ,weeks ,years depending on the technical analyss they have .
Scalpers : In one way or the orther i call this gambling because here they only take advantage of winning candle stcik ,they enetr the matket then quit faster after they make profit , it riksy be cause you can loose your assets.
SOME TECHNICAL ANALYSIS
any time a coin prie rise we say the bears are taking over the market because the price is increasing and when it is falling we say the bulls are pulling the market down , a coin price can drop to a level where it find it difficult to go down , hahaha this is wear the bulls are coming in with much energy to push the market up ,then at that point the market get support , it will then rise to another level where the bears will be pulling it down till the bulls release it to them at that point we say resistance of the bears to let the price go high is strong then the market has Resistance
so in simple term the support is the point where the price find it difficult to drop and Resistance is where the price find it difficult to rise higher again then it tend falling .
now let use the chart below to explain this :
.png)
From the picture above ,you saw where i circle with red there is a strong brigde there making it difficult for the price to go down beyond that price therefore is a strong support Where you an buy a coin .
let check the next image :
.png)
From the above you can see the level where the price was resisted from going up so entering the market at the support will have been the best , then at the resistance level some short term traders will withdraw and long term traders will wait to test the market if it will rise more than that or bounced back , if it is bounced back and return to the resistance again they take profit .
i think i shared enough on what i learnt today , i will like to say a big thanks to my crypto prof @stream4u and the the entire steem team especially @steemcurator01,@steemcurator02,@steemitblog
Hi @alhajibabajnr
Thank You For Showing Your Intrest in Steemit Crypto Academy
You have completed the homework task and made a good post, explained very nicely about How To Read Candlestick Charts In Different Time Frame & Information about Buy-Sell(Support & Resistance).
Remark: Homework Task Completed.
Thank You.
@stream4u
Crypto Professors : Steemit Crypto Academy
#india #affable