Crypto Academy Week 2. Homework Post for @stream4u | How To Read Candlestick Charts In Different Time Frame & Information about Buy-Sell
Hello again! 👋🏼
Here's @alegnita getting ready to keep learning in this great iniciative developed in the Steemit blockchain through the Crypto Academy. So, here you are my post for the task proposed by @stream4u.
Meaning of red/green candles
There's two main directions in any trading chart for exchanging assets, right? Up and down that is constantly in movement. The color red suggest the bearing influence or downing of the price against the last closing of it, meanwhile the green candle is talking about the bullish or the tendency of making a higher price than the previous one. Let's see these screenshots I've taken from Binance in the pair CAKE/BNB in a 1 minute frame.
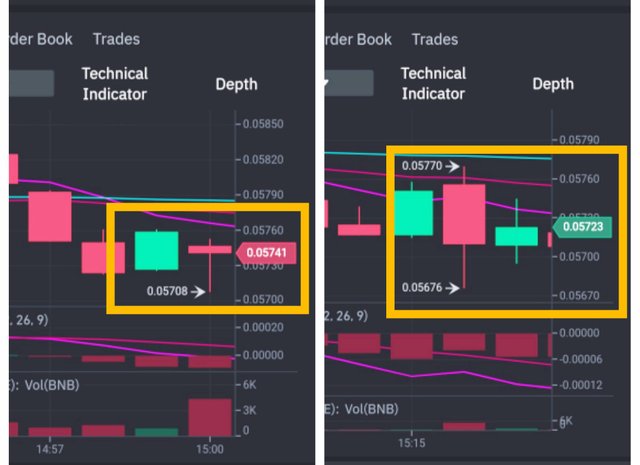
In the picture on the left, it looks that last green candle ended at around 0.05730 and the next one is red because has reached a lower price of 0.05708, where it will probably close in 0.05741 (a number that is lower than opening price, which is established at around 0.05750), moreover of not still having a higher price than 0.05760, the top of that green candle. If this is the case, it would turn in green for sure.
On the right side, we're having a green candle due to the fact of closing at 0.05723, a higher number than 0.05710 more or less (the opening price), indicating an increasing or bullish behavior.
Time frames available in Binance
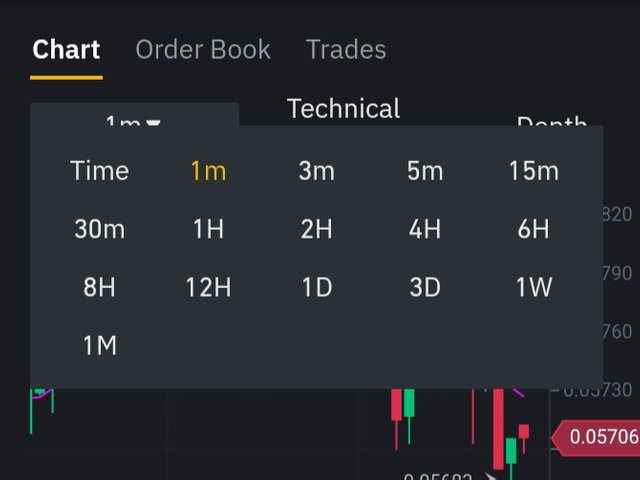
Over here we're having 1m, 3m, 5m, 15m, 30m, 1h, 2h, 4h, 6h, 8h, 12h, 1d, 3d, 1w and 1month time frames in the same pair of assets. If you see carefully between 30m and 1d time frames, for instance, obviously we're gonna have different behaviors, so that's why is necessary to select with a good criteria the best one you're looking for to analyze properly the tendencies, according to your objective and strategy of trading. That is: if you're going to long or short and even scalping, which is requiring a shorter time frames than the others.
Trend and price levels in the charts
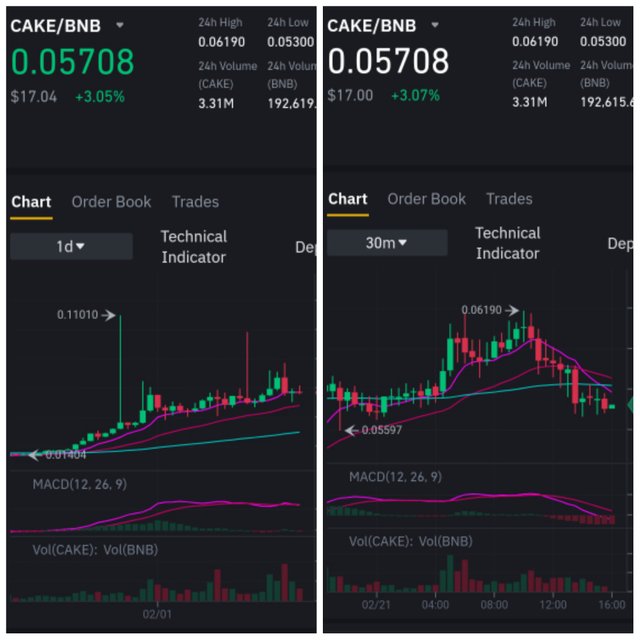
In the first graphic of 1d, we could find a trending increase of the CAKE price against the BNB asset with a pair of peaks during this tendency, but right now, at the chart for 30m, it's easy to deduct few waves that are going up and down from around 0.056, 0.059 and 0.062 as level prices.
Type of traders in the market
We might be traders that can go in long (wider time of investment by waiting for the increasing of assets) or short (start a position to go against tendency in order to get cheaper assets if they reach a lower number from that position). We can be doing scalping too but this must be done in a very brief time frame to seize any sudden change of price to obtain a considerable profit.
Supports and resistances
As they are doing a waving behavior of up and down constantly, we can talk about supports when the numbers are repeatedly not going down beyond that level, it means, they're "supporting" over certain point; and resistance, as we can understand from this word, the price hardly will raise to the other side of it, tending to "resist" and break in a higher unit amount.
Identifying these levels in any chart is very useful to grab the perfect moment to buy (over a support) or to sell (below a resistance). In this way we can be trading correctly without having a tremendous loss of our money by entering randomly in a market.
Finding levels and placing an order
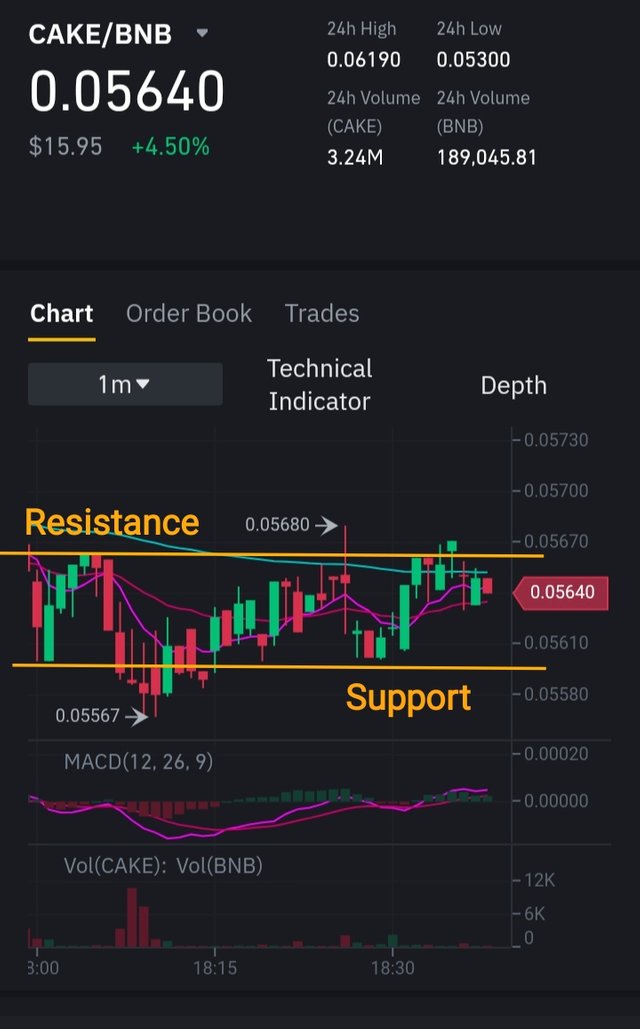
By seeing the following 1m time frame chart, I can quickly set an imaginary pair of straight lines to find out in which prices we can talk about these levels, according to the current tendency: 0.05595 as support and around 0.05660 as resistance. If I want to invest right now, I'll be buying at 0.05600 because I don't want to spend something that could be already expensive and then price goes down, so I'll be losing my money. Thanks for reading. 🤓
*** See you in the next post *** 📝
Thank You For Showing Your Intrest in Steemit Crypto Academy
You have completed the homework task and made a good post, explained very nicely about How To Read Candlestick Charts In Different Time Frame & Information about Buy-Sell(Support &
Resistance).
Remark: Homework Task Completed.
Thank You.
@stream4u
Crypto Professors : Steemit Crypto Academy
#india #affable
Thanks a lot for this great feedback. It's a huge motivation to keep doing the hard work in the Steemit blockchain. I learned something new with your useful tips that I will apply from now on for sure. Regards from my part. Have a good night. Cheers! 👍🏼
#venezuela #affable