Crypto Academy Week 10 - Homework Post for @stream4u

What Is Price Forecasting?
Price forecasting is a process in which you can find out rough estimate the price of a coin in market if it will go up or down this process includes many methods with the combination of all those methods you can have an idea off the market if it is in your favour Trader use this to make a good investment and to find out which is the right time to invest in the market this process is necessary for everyone home is going to get into investment I would say this is the first step that everyone should know before starting trading and investing in different coins and cryptocurrencies forecasting can never be 100% correct but it can give you our estimate of the market whitch is still better than going into the market without zero information so price forecasting is prediction of future price of a coin or asset
Discuss on why Price Forecasting is needed?
When we learn to drive first we learn about the car because without knowing about the car we can't drive the same thing is over here trading is what we will gonna do and for that we need price prediction we will have to learn the price prediction process because without that we want know which is the right asset to invest in and which is the right time to invest into the market and which is a perfect time to get out of the market price prediction is the first step of trading and once you know the art of price prediction you can make a really good amount of money price prediction help you to understand the acid better because when you are doing a price prediction you are analysing that coin or asset very deeply and you can a lot of knowledge because of that surprise protection is needed for trading and making profit
What Methods are best you feel for Price Prediction/Forecasting.
well there are mainly two types of analysis which are commonly used for the price prediction but we will talk about 3 because we are just learning and you should know about 3 man analysis and after that it depends upon your research if you want to use only two methods you can do that and if you want to use all of them you can use all of them so let me give you the methods and I will try to explain them with an example
1 Sentimental analysis
2 fundamental analysis
3 technical analysis
technical analysis
Let's talk about technical analysis first because this is the basic and every trader use this now you can see the name it says technical it means that in this analysis all the traders read the chart and the history of the asset and the price movement of that asset traders go and read all the the UPS and lows of that specific acid from 1 year ago for 2 year ago and from that that they get some sort of Idea about the acid will it go up or down in value so that is how technical analysis work the study of history and price movement of of a specific asset is technical analysis
fundamental analysis
in this type of analysis all the traders look up to the news and all the social media blogs about a specific coin or acid that they are trying to predict the price of so if there is a negative news then it can affect the price of that acid and if there is a positive news it means that the acid can go up in value and that will give them a rough estimate for price prediction Now traders can also combine technical analysis and fundamental analysis together and get a certain amount of idea about the coin or asset because they can see what happened in history when a positive news was spread about the coin that can help so that is fundamental analysis
Sentimental analysis
There are millions of traders in the cryptocurrency market And every trader has their own beliefs at some point in the market there are traders home by and there are traders home sell on that point Ok so it completely depends upon the buyers and sellers present in the market Let me explain you how so it's some point if the buyers are more than the sellers Now a common sense will say the price will go up in that is right answer and when the sellers are more than buyers the price will go down because everyone is selling and no one is buying there is no demand traders look for the data of what other traders feel about a specific coin for asset Now if there are more buyers in the market then the trader will buy because there is a buying opportunity and if the data says that there are more sellers in the market at that point then the trader will sell because the price will come down so that is how Sentimental analysis work
Take any Crypto Asset Chart graph and explain how to do Price Forecasting? OR Take any Crypto Assets Chart graph & as per its current price tell us what will be its future price for next 1 week or 1 month? You can predict for any direction up or down but explain it properly on what basis you have predicted the price.
Well I will try to explain how to use a technical analysis using chart
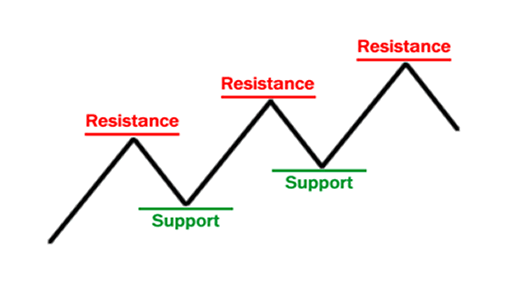
let me explain what is Resistance and support so as we all know that when a market moves it always moves in a zigzag shape And it stay on certain points while going up and while going down And where it stay for a long time it makes a resistance and support level at that point where it stay for a long time while going up or while going down Which is followed next time by the market For example when a market is going up its tops on the previous level two or three times Open resistance and then It cross that level and go up Now that same resistance level will be converted into a support and it will stop the market from coming down And we call that support level you can see in the picture the resistance level becomes support and support becomes resistance
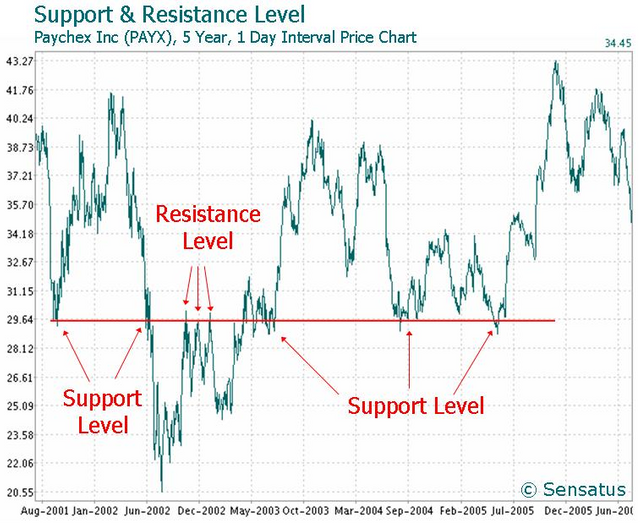
I'll try to explain you how support and resistance work and how it can give you some really good idea about the market and it can help you make good decisions
I in an uptrend Likely scenario if you are looking To continue in this uptrend One of the best way is to look for Support and resistance Traits to look at the previous level Of resistance that was broken To become support This is how we used a support and resistance For an entry point in a trend continuation Model and in a trending Market is by using Is there previous level of resistance Is possible support
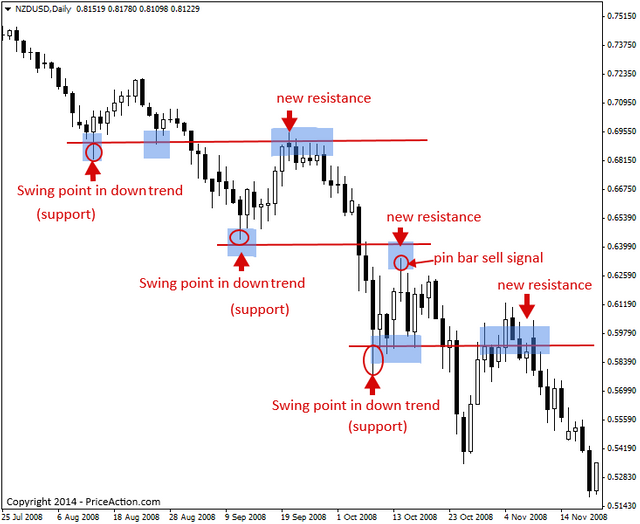
What you are looking at in the bearish Trend it is for the market to go up back To the previous level of structural support That now we expect to become Resistance So now this strategy is called the break and retest Strategy What we are trying to achieve with this strategy again is Is the market to break below Application level of support Come back to that level And provide a trading opportunity
That was my homework thank you so much for reading it
Hi @akashhassan
Thank you for joining The Steemit Crypto Academy Courses and participated in the Week 10 Homework Task.
Your Week 10 Homework Task verification has been done by @Stream4u, hope you have enjoyed and learned something new.
Thank You.
@stream4u
Crypto Professors : Steemit Crypto Academy