Steemit Crypto Academy Season 3- Dynamic Course for Beginners - Week 5 || Trade with "Simple and Exponential Moving Averages" + application of "Fibonacci Retracements" on the chart || By @ahsanjawed
Steemit Crypto Academy Season 3- Dynamic Course for Beginners - Week 5 || Trade with "Simple and Exponential Moving Averages" + application of "Fibonacci Retracements" on the chart || For @lenonmc21 By @ahsanjawed

💥Theory (No images)
💥Question no: 01

💥Simple Moving Average (SMA)
There are many different forms of SMAs (Simple Moving Averages), which are one of the most significant indicators in technical analysis. The SMA is the easiest to build moving average. It's just the average price for a time. The average is referred to as "moving," since the bar of the chart shows a line that travels alongside the chart with the change in the average value.
💥Exponential Moving Average (EMA)
The EMA (Exponential Moving Average), which measures a trend direction over some time is comparable to the Simple Moving Average (SMA). Even though SMA just calculates average price data, EMA uses greater weight for current data. EMA is more carefully monitoring prices than an associated SMA due to its unique calculation.
💥Theory (No images)
💥Question no: 02
You must be able to compute a simple moving average or SMA before starting the calculation of exponential moving averages. SMAs and EMAs are often based on inventory closing prices.
💥Calculating SMA
You compute the mathematical average to get a simple average. That is to say, you add up all the closing prices in your SMA then split by the number of closing prices. You will first sum all closing prices from the past 10 days, and then divide them by 10, when, for instance, you calculate a ten-day SMA. If the closing prices are 15 dollars, 18 dollar , 14 dollars, 15 dollars, 21 dollars, 22 dollars, 24 dollars 25 dollars, 28 dollars and 38 dollars, the SMA would be: The closing prices are:
 15+18+14+15+21+22+24+25+28+38=220

220/10=22
So for that period of 10 days, the average closing price is 22 dollars. But to make the SMA useful, you should generate and chart several SMAs, and since each SMA only handles the preceding 10 days of data, you will utilize it daily to produce a new SMA every day, which you want on your chart.
💥Calculating EMA
One more observation than the SMA is needed to calculate the EMA. Assume you'll be using the EMA number of observations for 10 days. On the tenth day, you must wait for the SMA. The computation for the SMA is simple. It's just the total of inventory closing prices for a certain time period divided by the number of observations made during that time period.
The EMA smoothing multiplier (weighting) is calculated typically with a formula [2 ÷ (number of observations + 1)]. [2/(10+1)]=0.1818 is the multiplier for a 20-day moving average.
Finally, the following formula is used to calculate the current EMA:
EMA = Closing price x multiplier + EMA (previous day) x (1-multiplier)
💥Theory (No images)
💥Question no: 03
- Trend lines can also be used to identify regions of support or resistance. A rising EMA tends to promote price movement, whereas a falling EMA tends to provide resistance. This supports the purchasing when the price is near the rising EMA and selling when the price is near the falling EMA strategy.
- Crossing of prices Trading signals is frequently triggered by SMAs. When prices cross above the SMA, you should consider going long or covering short; when prices cross below the SMA, you should consider going short or exiting long.
- Use the exponential moving average (EMA) to detect trend direction and trade in that manner. When the EMA rises, you should consider buying when prices fall near or slightly below it. When the EMA falls, you may want to sell when prices rise to or slightly above it.
- SMA Another popular trading indicator is the crossing of the SMA. You may wish to go long when a short period SMA crosses above a long period SMA. When the short-term SMA crosses below the long-term SMA, you may wish to go short.
💥Theory (No images)
💥Question no: 04
- Unlike the simple moving average, which can be very simple if used alone, the exponential moving average allows us to have a faster response to detecting an early trend, which is useful when working with a short-term period, whereas the simple moving average is more useful when working with a long-term period.
- The average price of a security over a certain time period is known as the simple moving average (SMA). The 60-day moving average, for example, is computed by dividing the past 60 days' total of closing prices by 60. As fresh data is received, the average is recalculated, resulting in a "moving average."
- The 200-day EMA is more responsive to recent price changes in indexes like the S&P 500, which is not unexpected given that the exponential moving average has a shorter lag period than the basic moving average.
On the other hand, The SMA is a reliable measure of average prices over a given time period. As a result, most technical analysts use the SMA to determine support and resistance levels.
💥Theory (No images)
💥Question no: 05
💥"Fibonacci Retracements"
The retracing levels of Fibonacci are a valuable tool to predict how much progress will follow in some of the key trends before this trend is re-launched. In gold, silver, and mining equities as well as the foreign exchange markets, Fibonacci retracements were highly beneficial.
The notion of the price tracing some of the covered distance following a move in the direction of the main trend is quite ancient. Charles Dow recommended that this retracing range be between 33 to 66 percent in his study on the operation of the stock market.
Ralph Nelson Elliott improved this theory by utilizing more precise retracement levels: 38.2 percent, 50 percent, and 61.8 percent, which were calculated using the Fibonacci sequence, which was discovered by Leonardo Fibonacci was an Italian mathematician who lived in the thirteenth century.
1, 1, 2, 3, 5, 8, 13, 21, 34, 55, 89, 144,... is the Fibonacci sequence (it goes on this way to infinity). To put it another way, each term (beginning with the third) is the total of the two before it: 1+1=2, 1+2=3, 2+3=5, 3+5=8, and so on. - As we go closer to infinity, the ratio of one element to its predecessor approaches 1.618 (the convergence starts to take shape after a few elements: 1/1=1, 2/1=2, 3/2=1.5, 5/3=1.667, 8/5=1.6, 13/8=1.625, 21/13=1,615, 34/21=1.619, 55/34=1.618, and so on). The golden ratio, also known as the phi number, is found everywhere in nature (e.g. human body proportions, the solar system, DNA), culture (e.g. art and architecture, music), and – as will be seen later – the financial market.
- Alternate number ratios converge to 2.618 or its inverse, 0.382. 55/21=2.619 and 21/55=0.382, for example.
When it comes to calculating Fibonacci retracement levels, these ratios, 0.382 and 0.618 (corresponding to 38.2 percent and 61.8 percent, respectively), are utilized instead of Dow's "standard" 33 percent and 66 percent. This method predicts that after hitting the top or bottom of a particularly strong trend, prices will retrace roughly 38 percent before continuing to move further. The greatest retracement in a weaker trend is about 62 percent of the preceding advance.
Fibonacci retracements may be utilized in both positive and negative patterns, allowing investors to predict how long a trend will last and when a positive comeback will occur following a big price drop.
💥Practice (Only Use your own images)
💥Question no: 01
💥STEP # 01
For this you have to go on Tradingview , Then select any coin you want, here I take Steem Coin, Then click on the INDICATORS icon. See

💥STEP # 02
Then Search Here MOVING AVERAGE, and add this.

💥STEP # 03
Now click on the SETTING here, See in the screenshot

💥STEP # 04
Now Goto to STYLE and set blue colour and Set the Lenght to 100 in INPUT option


💥STEP # 05
After this Again do the same think go to the INDICATOR option, and now search MOVING AVERAGE Exponential and add this.

💥STEP # 06
Again do the same think, In STYLE set Red Color and In INPUTS set Length to 200.


💥STEP # 07
Now you can see SMA and EMA.

💥Practice (Only Use your own images)
💥Question no: 02
💥STEP # 01
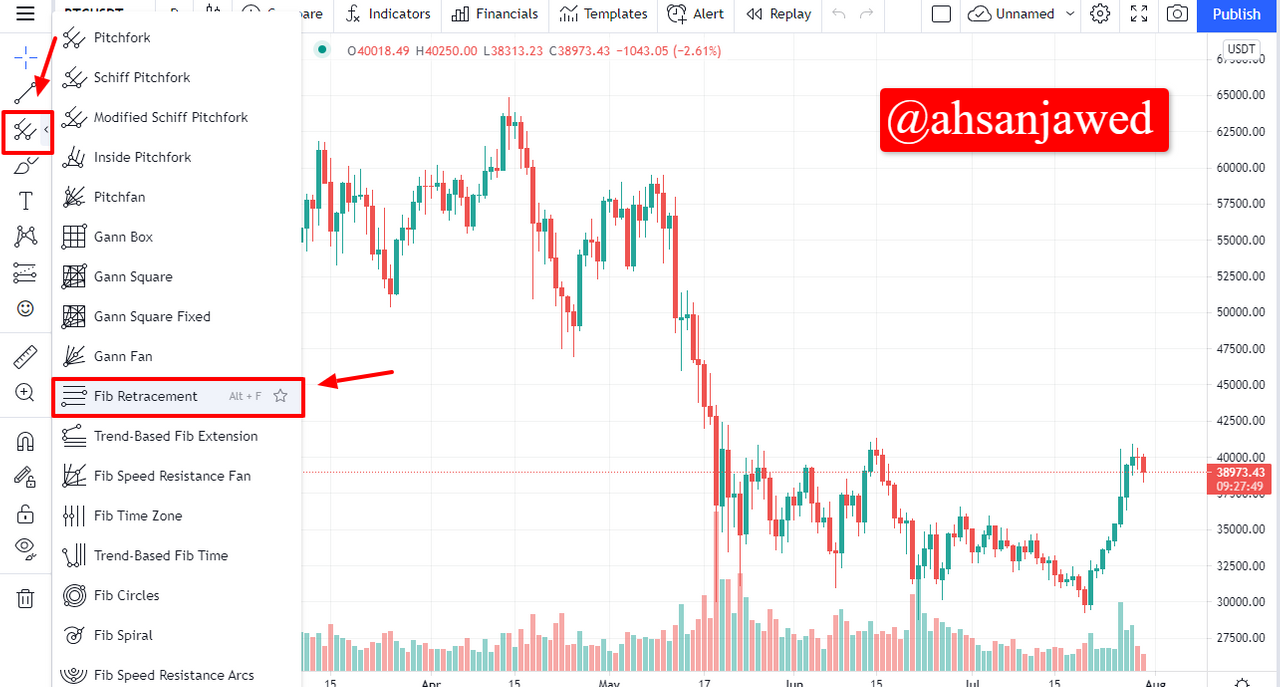
First of all you Go to the Toolbar on the left of the screen. and click on the Fib Retracement. See the screenshot
💥STEP # 02/Bullish Trend
After this, draw the path from the bottom side to the peak side of the chart you desire retracing. For the bullish trend. see the screenshot below.

💥STEP # 03/Bearish Trend
Do the reverse of the bullish rhythm to find bearish Trend. Draw the slope up to down from the swing. The lines appers is bearish Trend. see the screenshot

💥Conclusion
This content appears to be plagiarised as indicated by @lenonmc21
If you have not already done so, you should head to the newcomers community and complete the newcomer achievement programme. Not only will you earn money through upvotes, you will learn about content etiquette;
Notification to community administrators and moderators:
@steemcurator01 ADMIN
@sapwood MOD Professor[Advanced]
@steemcurator02 MOD