Trading Using Fibonacci Retracement Levels
An important component of crypto trading is technical analysis, which gives investors the access to examine market trends and arrive at wise choices. Fibonacci retracement is one of these frequent tools used in the cryptocurrency market.
 Cover photo edited using PixelLab
| How Fibonacci Retracement is Being Applied in Crypto Markets and Explanation of Its Concept as a Technical Analysis Tool |
|---|
This technical analysis tool called the Fibonacci retracement is based on the Fibonacci sequence, which is a set of numbers where each number is equal to the sum of the two numbers before it. Example is showing below.
Example; 0, 1, 1, 2, 3, 5, 8, 13 and so on
Retracement levels that primarily retains the Fibonacci ratios are shown below and these levels are retained to pinpoint probable zones of a market trend's support and resistance.
Ratio; 23.6%, 38.2%, 50%, 61.8%, add 100%.
In order to detect the possible entry and exit positions, Fibonacci retracement can be applied in conjunction with candlestick patterns. Example of this is; when a bullish candlestick pattern appears close to a Fibonacci support level, traders may see it as a buying opportunity. On the other hand, a bearish candlestick pattern close to a Fibonacci resistance level can suggest a good time to short.
| Utilization of Tradingview to Illustrate Fibonacci Retracement Levels of Different Pairs During Both Uptrend and Downtrend ( BTC/USDT, ETH/USDT, and STEEM/USDT) |
|---|
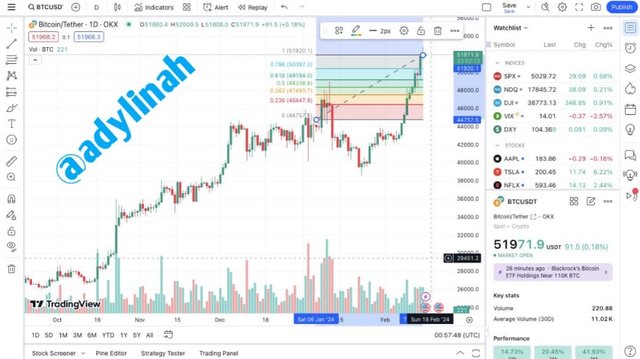 BTC/USDT BTC/USDT | 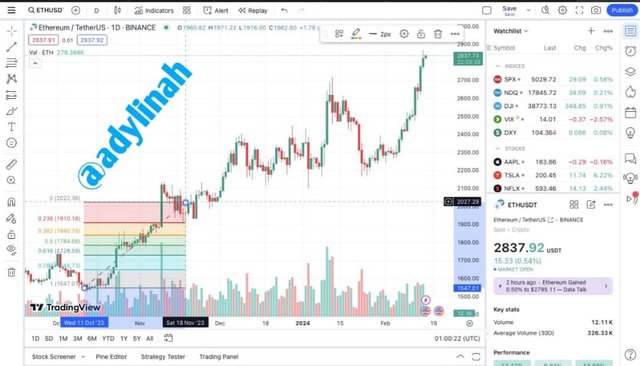 ETH/USDT ETH/USDT | 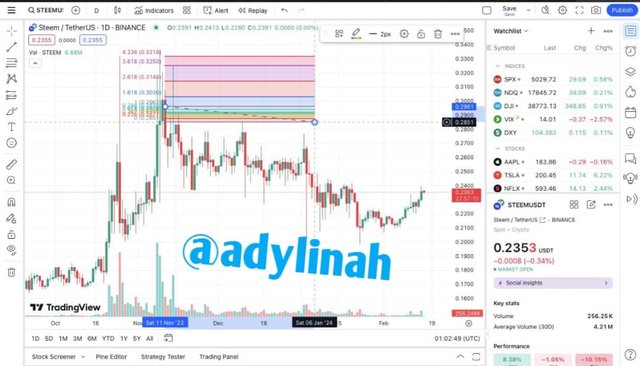 STEEM/USDT STEEM/USDT |
|---|
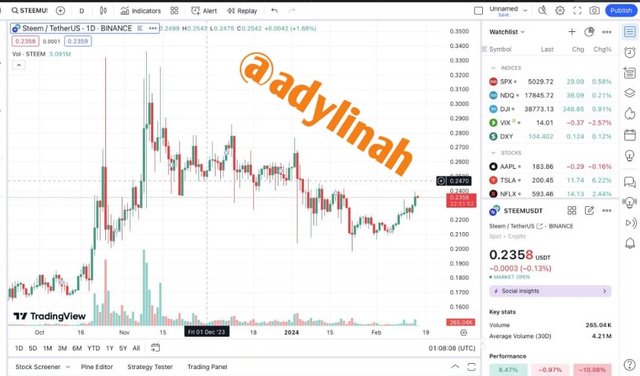
The above images (3) are gotten from a popular charting program among traders, Tradingview, which shows the illustration of Fibonacci retracement levels on different pairs
during both uptrends and downtrends which can visually be detected by simply applying Fibonacci retracement to trading pairs like; BTC/USDT, ETH/USDT, and STEEM/USDT.
| The Significance, and Break Down of Various Keys Fibonacci Levels and the Explanation on How Traders Interprets the Levels |
|---|
Important Fibonacci numbers, such as; 0.382, 0.500, and 0.618, are very much needed for traders. A half retracement of the preceding move is indicated by the 0.500 level, and a moderate retracement is indicated by the 0.382 level.
The "golden ratio," or 0.618 level, is regarded as a strong level of retracement. These levels are used by traders to suggest possible zones of support and resistance where the price might turn around or stick with its current direction.
| Exploration of Fibonacci Retracement with Other Technical Indicators' Synergy |
|---|
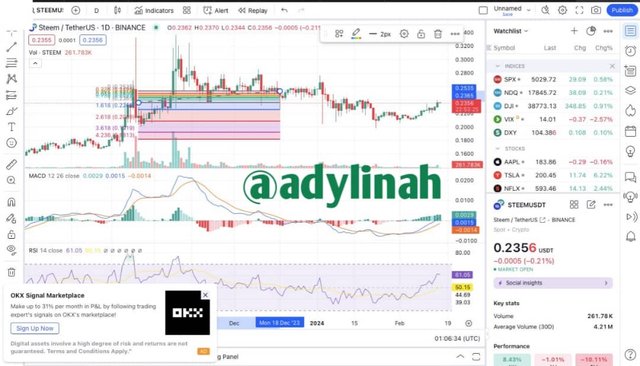
In order to improve analysis, the Fibonacci retracement can be joined with other technical indicators like; Moving Averages (MA) and Relative Strength Index (RSI).
Let's see the difference between these two indicators;
| Relative Strength Index (RSI) | Moving Averages (MA) |
|---|---|
| RSI is used to determine overbought or oversold circumstances by measuring the amount of recent price changes | While MA are simply useful for method of identifying trends and possible places of support or resistance. |
Fibonacci retracement can then be combined with these indicators ( MA and RSI) to provide traders a more thorough and understandable grasp of market movements.
Also, in order to support their analysis, traders consistently search for confluence between Fibonacci retracement levels and other technical indicators or chart patterns. In other words; if a Fibonacci level coincides with a moving average, It makes a stronger case for a possible trend reversal or continuance given its previous support/resistance level.
| Recent Price Action Analysis of STEEM/USDT by Making Use of Fibonacci Retracement |
|---|
By making use of Fibonacci retracement to analyze recent market action on the STEEM/USDT pair, Fibonacci levels can be used to identify significant retracement levels on STEEM/USDT charts and to examine price movements in response to these levels. An overview of possible locations of support and resistance for traders of STEEM/USDT will be provided by this analysis.
In conclusion, the Fibonacci retracement is an effective instrument in cryptocurrency trading that gives traders a methodical way to examine price changes and pinpoint possible entry and exit locations. A more thorough examination of market patterns can be obtained by combining Fibonacci retracement with other technical indicators. By being aware of the Fibonacci retracement idea and its use, traders can improve their trading tactics and reach better judgments. Thank you!
I will invite @steemdoctor1, @eliany and @enamul17 to join the contest.

Upvoted. Thank You for sending some of your rewards to @null. It will make Steem stronger.
The example you provided makes it easier to understand how these retracement levels are derived and used to identify potential zones of support and resistance in the market trends.
Combining Fibonacci retracement with candlestick patterns for entry and exit positions makes this analysis easier to understand. Thank you for a well articulated post!
Thank you for reading my article and dropping a valuable comment.
Hello friend greetings to you, hope you are doing well and good there.
Fibonacci is the best tool we use to find the retracement in market. It shows us the possible correction the market can take. The most important Fibonacci levels are the golden one. 0.38, 0.5 and 0.61 are the golden levels. Using this with other trading tools can make our analysis more accurate and perfect. You have beautifully explained all the charts here of Fibonacci.
I wish you very best of luck in this contest.
Thank you for the best wishes and good feedback on my article
Greetings,
Although the rating can be disheartening, I must say your post is seriously informative. It breaks down the concept of Fibonacci retracement in such a way that anyone can understand, even those who are new to cryptocurrency trading. The practical application you provide really helps to solidify the understanding. Great job, hope to have you more motivated for next week.
Thank you for your encouraging comment.
@adylinah Your detailed breakdown of Fibonacci retracement and its application in crypto trading is incredibly insightful. The Tradingview charts really add a visual dimension to understanding the concept. Your integration of Fibonacci with other indicators like MA and RSI is a smart approach Wishing you the best of luck in the contest.
This comment shows that you took time to scan through my entry. Thank you!
Dear friend,
I would say that your effort in making this research and putting it down is very commendable.
Especially, for someone that don't know much about trading. This is a good step in the right direction.
As you continue in this, you will definitely perfect in it.
Good job from you.
It is said that “practice makes prefect”!. I am open for corrections and zealous to gain more knowledge. Thank you for the support and encouragement!
El indicador RSI resulta genial cuando lo utilizas con los RF, ya que provee información adicional y valiosa para los operadores como los momentos de compra y de venta, que tan fuerte es la tendencia interna o cuándo se acerca un cambio de tendencia. Es muy útil para establecer una estrategia de trading.
Gracias por compartir, saludos y éxitos.
TEAM 5
Congratulations! Your post has been upvoted through steemcurator08.Many thanks @josepha for the support 🙏🏻
Your article contains a detailed description of the application of Fibonacci recursion, which is very important in crypto trading. You have explained this through charts which are helpful for visualization. A wise approach is to use Fibonacci in combination with other indicators. good wishes.