This Fibonacci pattern is interesting 🤔
(Formerly, Twitter)
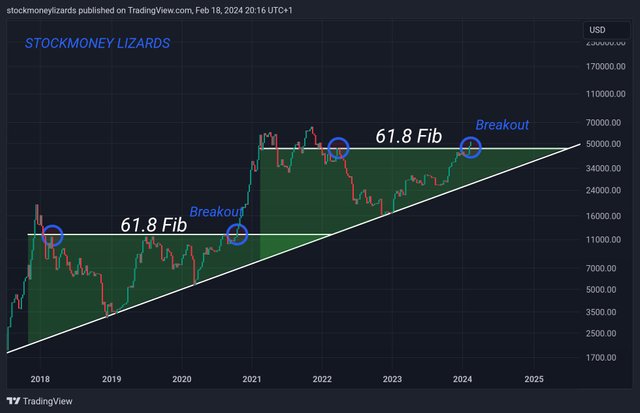
Take a look at the BTC(Bitcoin) chart 🧐 There are the Fibonacci resistance lines. When the BTC price broke the 61.8 Fibonacci resistance line, the BTC started the huge bullish market. Now, the BTC price just broke the 61.8 Fibonacci resistance line. It looks like a positive signal for the crypto market. Interesting 😲
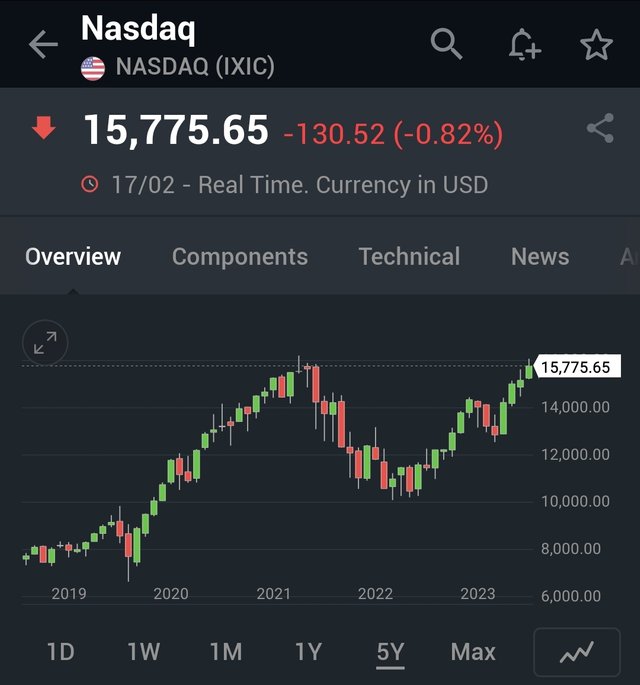
NASDAQ, one of the major 🇺🇸 stock market indicies, is still struggling to break the 2021 ATH(All Time High). I think the NASDAQ will break the ATH first rather than the BTC. Then, the next turn would be the BTC. However, I'm not sure how many fluctuating the BTC price will it be. Fasten your seat belt.


This comment is for rewarding my analysis activities. Upvoting will be proceeded by @h4lab
This post was upvoted by @upex upvoting Services with 99.45%. To learn more Join our Discord community here.

I always ask myself how this even is possible the charts do it but there it is!