Take a look at the BTC 1y RSI chart 🤔
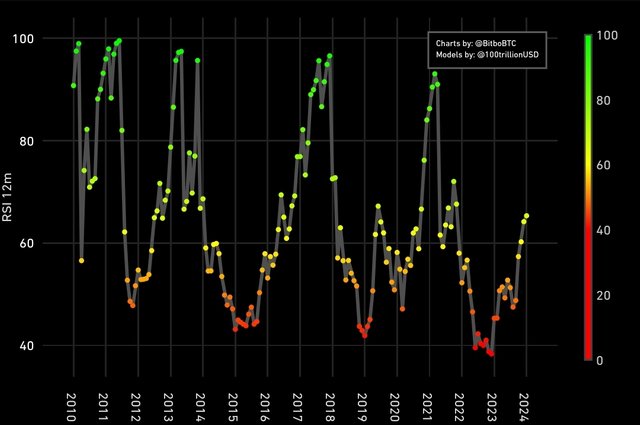
I found something in common 🤔 As you know, there have been 3 huge bullish markets during the last 13 years. When the bullish market started, and the 1y RSI(Relative Strength Index) broke 65, the BTC(Bitcoin) had small price corrections or a massive correction like COVID-19 collapse.
Now, the BTC 1y RSI is 65.34.. 😱 Definitely, we need to prepare the next BTC price movement.. Well, first of all, I think the macroeconomy is still ok.
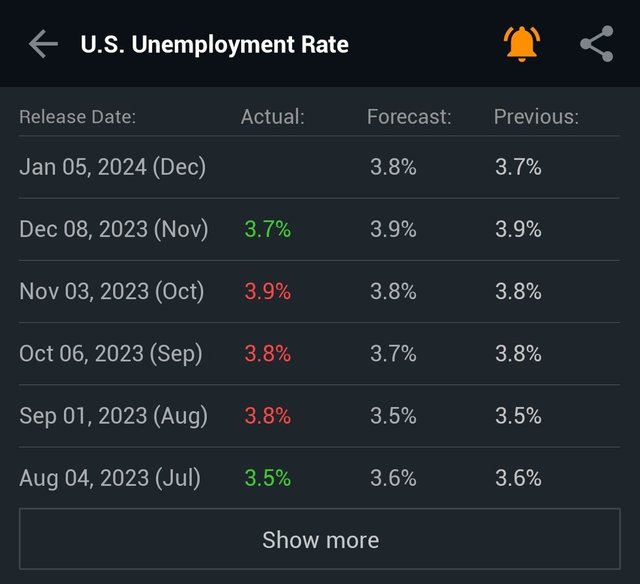
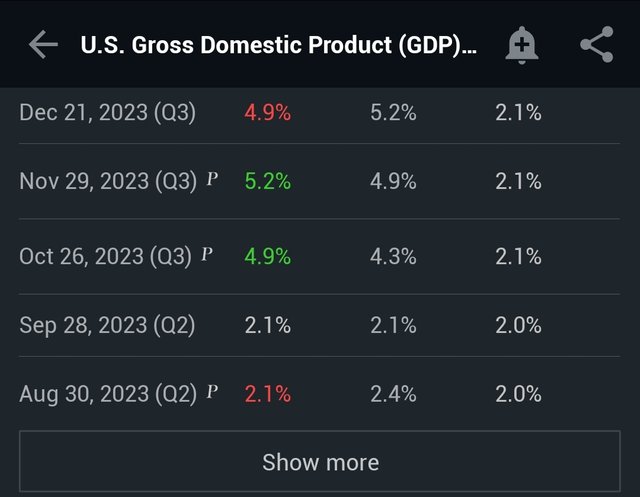
Because, the U.S. labor market is still robust and the GDP(Gross Domestic Product) growth rate is looking good. It seems that the next recession is coming at least 1 year later. That means this year might be a good opportunity for the crypto market. So, I think the next step of the BTC price movement is.. a small correction or going more sideways.
Well, if spot BTC ETF(Exchange-Traded Fund)s applications are approved within 3~4 days, the BTC price will be able to surge more. However, the chart indicates to prepare the next step. Nevertheless, I believe that the next huge bullish market will start after the BTC 4th halving.
One of the methods winning institutional investors is just hodling your cryptos with DYOR(Do Your Own Research) before touching your TP(Target Price). It's tough and nervous time. Let's overcome this period. LFG! 🚀💫
This comment is for rewarding my analysis activities. Upvoting will be proceeded by @h4lab
In your article, you forgot to say that the US government debt is growing very fast and this is a problem for the entire global economy