[vue] network chart 그리기
상호간의 관계와 해당 흐름을 보여주고자 할 때에도 네트워크 그래프는 많은 도움을 줄 수 있습니다 :)
예전에는 gojs 라는 상용을 사용했는데 ... 찾아보니 v-network-graph 라는 좋은 라이브러리가 존재 하네요 ㅋ
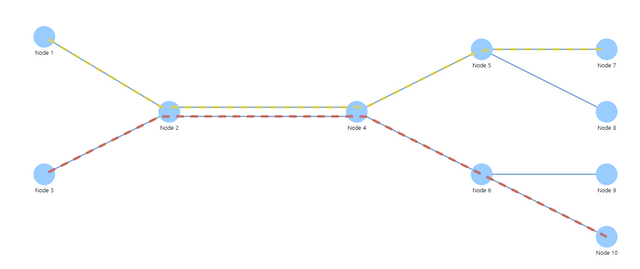
그래서 바로 테스트를 해봤습니다. 이쁘게 잘 나옵니다 ㅎㅎ
코드
코드 또한 아래와 같이 간결 합니다. 물론 다양한 커스텀 설정을 하면 복잡 하겠지만, 정말 편하게 쓸 수 있는 라이브러리 같습니다. ( 설명도 정말 잘 되어 있음 )
<script setup lang="ts">
import { onMounted, ref } from "vue";
import * as vNG from "v-network-graph";
import data from "./AutomaticLayout.data";

// dagre: Directed graph layout for JavaScript
// https://github.com/dagrejs/dagre
//@ts-ignore
import dagre from "dagre/dist/dagre.min.js";

const nodeSize = 20;

const configs = vNG.defineConfigs({
  node: {
    normal: { radius: nodeSize / 2 },
    label: { direction: "south-east", color: "#000000" },
  },
  edge: {
    normal: {
      color: "#aaa",
      width: 2,
    },
    margin: 20,
    marker: {
      target: {
        type: "arrow",
        width: 4,
        height: 4,
      },
    },
  },
});

const graph = ref<vNG.VNetworkGraphInstance>();

onMounted(() => {
  layout("LR");
});

function layout(direction: "TB" | "LR") {
  if (
    Object.keys(data.nodes).length <= 1 ||
    Object.keys(data.edges).length == 0
  ) {
    return;
  }

  // convert graph
  // ref: https://github.com/dagrejs/dagre/wiki
  const g = new dagre.graphlib.Graph();
  // Set an object for the graph label
  g.setGraph({
    rankdir: direction,
    nodesep: nodeSize * 2,
    edgesep: nodeSize,
    ranksep: nodeSize * 2,
  });
  // Default to assigning a new object as a label for each new edge.
  g.setDefaultEdgeLabel(() => ({}));

  // Add nodes to the graph. The first argument is the node id. The second is
  // metadata about the node. In this case we're going to add labels to each of
  // our nodes.
  Object.entries(data.nodes).forEach(([nodeId, node]) => {
    g.setNode(nodeId, { label: node.name, width: nodeSize, height: nodeSize });
  });

  // Add edges to the graph.
  Object.values(data.edges).forEach((edge) => {
    g.setEdge(edge.source, edge.target);
  });

  dagre.layout(g);

  const box: Record<string, number | undefined> = {};
  g.nodes().forEach((nodeId: string) => {
    // update node position
    const x = g.node(nodeId).x;
    const y = g.node(nodeId).y;
    data.layouts.nodes[nodeId] = { x, y };

    // calculate bounding box size
    box.top = box.top ? Math.min(box.top, y) : y;
    box.bottom = box.bottom ? Math.max(box.bottom, y) : y;
    box.left = box.left ? Math.min(box.left, x) : x;
    box.right = box.right ? Math.max(box.right, x) : x;
  });

  const graphMargin = nodeSize * 2;
  const viewBox = {
    top: (box.top ?? 0) - graphMargin,
    bottom: (box.bottom ?? 0) + graphMargin,
    left: (box.left ?? 0) - graphMargin,
    right: (box.right ?? 0) + graphMargin,
  };
  graph.value?.setViewBox(viewBox);
}

function updateLayout(direction: "TB" | "LR") {
  // Animates the movement of an element.
  graph.value?.transitionWhile(() => {
    layout(direction);
  });
}
</script>

<template>
  (html comment removed:  <div class="demo-control-panel">
    <el-button @click="updateLayout('LR')">Layout: Left to Right</el-button>
    <el-button @click="updateLayout('TB')">Layout: Top to Bottom</el-button>
  </div> )

  <v-network-graph
    ref="graph"
    class="graph"
    :nodes="data.nodes"
    :edges="data.edges"
    :layouts="data.layouts"
    :configs="configs"
  >
    <template
      #override-node-label="{
        nodeId,
        scale,
        text,
        x,
        y,
        config,
        textAnchor,
        dominantBaseline,
      }"
    >
      <text
        x="0"
        y="0"
        :font-size="9 * scale"
        text-anchor="middle"
        dominant-baseline="central"
        fill="#ffffff"
        >{{ nodeId }}</text
      >
      <text
        :x="x"
        :y="y"
        :font-size="config.fontSize * scale"
        :text-anchor="textAnchor"
        :dominant-baseline="dominantBaseline"
        :fill="config.color"
        >{{ text }}</text
      >
    </template>
  </v-network-graph>
</template>
맺음말
요즘은 역시 잘 가져다 쓰는 사람이 승자 같네요. 그리고 개발도 중요하지만 환경 설정이 중요한 것 같습니다.
위 예시도 사실 vite + vue + ts 구성으로 설치 했는데 보일러 플레이트 만드는 방법을 모른다면 개발 환경 구성하는데도 많은 시간을 소비하기 때문입니다.
[광고] STEEM 개발자 커뮤니티에 참여 하시면, 다양한 혜택을 받을 수 있습니다.
@wonsama transfered 2 KRWP to @krwp.burn. voting percent : 74.44%, voting power : 18.16%, steem power : 1989479.46, STU KRW : 1200.
@wonsama staking status : 1793.429 KRWP
@wonsama limit for KRWP voting service : 1.793 KRWP (rate : 0.001)
What you sent : 2 KRWP
Refund balance : 0.207 KRWP [65243348 - e4af459055b0ac305a8832908fa1387f004be30c]
Upvoted! Thank you for supporting witness @jswit.