You are viewing a single comment's thread from:
RE: Gridcoin's Effect on BOINC - It's In The Numbers
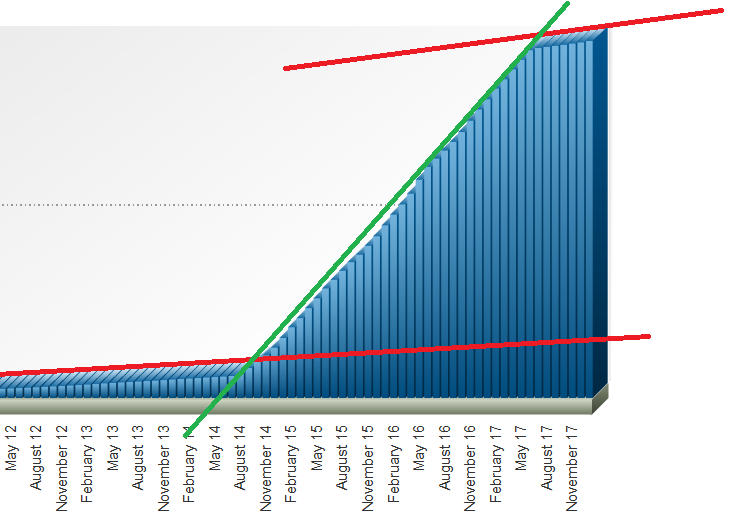
What I can see is that you have taken the combined charts with ASICS. Was there any mining happening using BOINC during this period of time (green line in chart below)? For example team Bitcoin Australia was active from August-14 till July-16 where their credit went up from 0 to 69B and they have since then stopped. Another team following a similar pattern is mining@EVGA.
Analysing the overal BOINC credit chart below, the steep increase is for a period of 3 years (green line). Before and after this period, the increase looks similar and more muted (2 red lines).
These are ASIC included stats. Unfortunately, the non-asic stats I could find do not go back to the pre-gridcoin era. I think this is something to be considered when viewing these stats, particularly in chart 1, but I doubt that ASICs alone can be responsible for the trends we see in these charts.
Looking at the dates you bring up, I think a correlation connection to Gridcoin is more accurate than a connection to ASICs, but only better stats can say for sure.
I know you do stats so much better than I do, so if you've got things to add, please do! = )
The Bitcoin Utopia project handed out an enormous amount of credit.
Thanks @jimbo, I think this is a very important driver. The credit growth of Bitcoin Utopia matches the steep increase of overall credit nicely.
Good point!
Trend lines! Channels! Does TA maybe apply here?