Gridcoin's Effect on BOINC - It's In The Numbers
Have you ever wondered what Gridcoin has done for BOINC in terms of numbers? Here are three charts from boincstats that help illustrate just that!
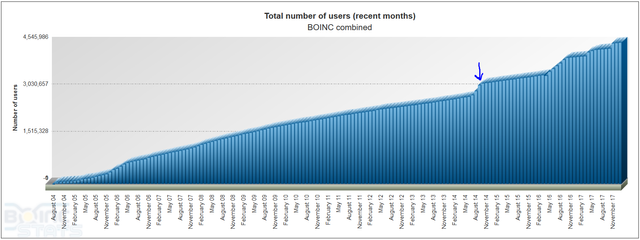
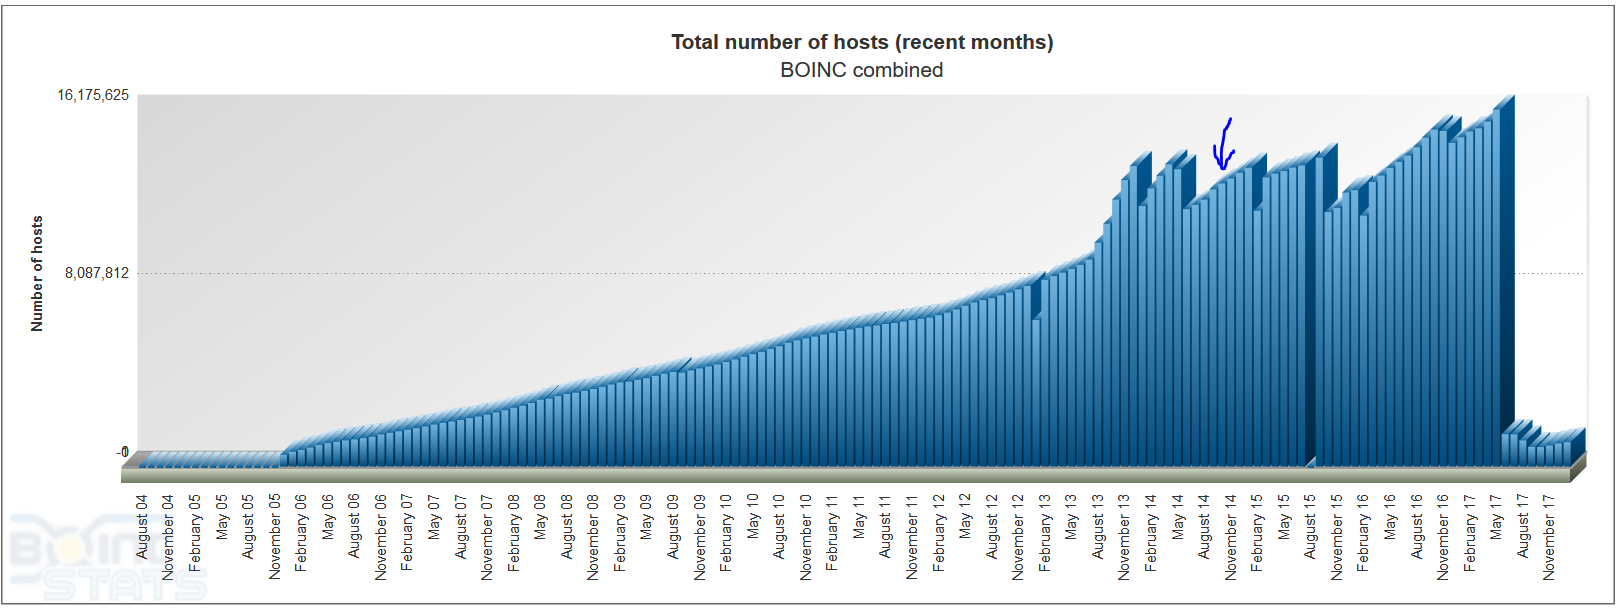
Gridcoin switched from GRC-Classic (PoW) to GRC-ResearchMint (Various combinations of PoS and PoR -- currently PoS) on October 11th, 2014. I have added arrows on the charts that approximate this date.
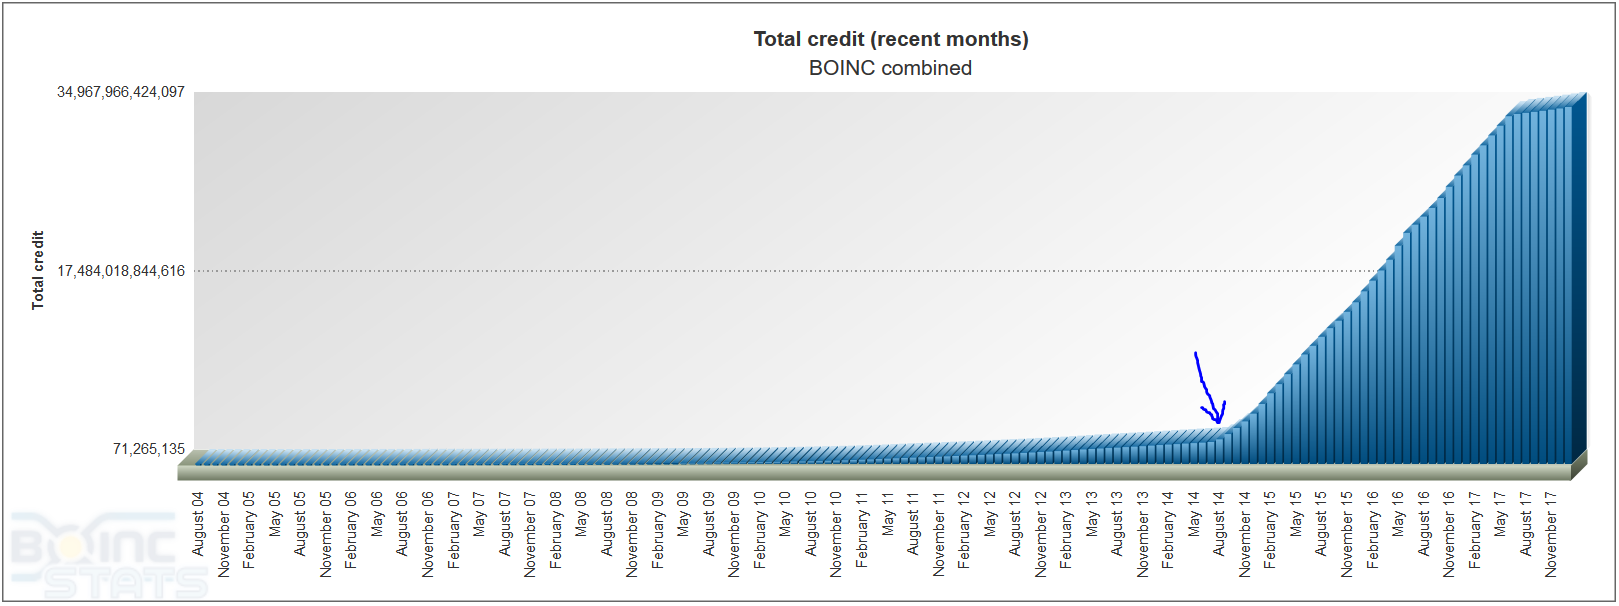
As you can see, Gridcoin has brought an increase in earned credits, which may correlate to more completed Work Units, depending on data regarding how projects calculate credits and whether these processes have changed over time.
Gridcoin has likely increased the rate of user adoption, though this correlation is not as strong. Then again, it appears that Gridcoin may have reversed a flattening trend and is beginning to increase the rate of user adoption even further. Time, and the data it brings, will tell.
And with respect to the third chart, it seems like Gridcoin may have had an effect on the number of hosts working on BOINC tasks, however this chart seems to have some errors and awkward trends.
With chart 1 and 3, you can see that something happened in June of 2017. The total number of credits produced plateaus while the total number of hosts drops dramatically.
June 2017 was about the time that crypto began its resurgence (BTC broke 2,000 USD), so this may be a factor. People may have switched their processing to mine more profitable coins, as GRC has only just become profitable again.
While a drop of over 10 million hosts would definitely cause a plateau in credits earned, it is hard to imagine that the total number of hosts dropped from about 16 million to under 5 million in less than a month.
Perhaps there was a change in the stats collection and organization processes at around this time.
Does anyone have more information on what happened in June 2017?
Any other ideas?
Host clear up after 1 year inactivity but any database issue to boincstats would look strange in those graphs.
Can´t point out why what cause but Willy would know.
Support website for more stable data to web:
GRC RzXRNQU8rBwS2VSAzP4vzk5ug2wnZKUP5H
which website is this address supporting?
https://boincstats.com/en/page/donate
donated
What I can see is that you have taken the combined charts with ASICS. Was there any mining happening using BOINC during this period of time (green line in chart below)? For example team Bitcoin Australia was active from August-14 till July-16 where their credit went up from 0 to 69B and they have since then stopped. Another team following a similar pattern is mining@EVGA.
Analysing the overal BOINC credit chart below, the steep increase is for a period of 3 years (green line). Before and after this period, the increase looks similar and more muted (2 red lines).
These are ASIC included stats. Unfortunately, the non-asic stats I could find do not go back to the pre-gridcoin era. I think this is something to be considered when viewing these stats, particularly in chart 1, but I doubt that ASICs alone can be responsible for the trends we see in these charts.
Looking at the dates you bring up, I think a correlation connection to Gridcoin is more accurate than a connection to ASICs, but only better stats can say for sure.
I know you do stats so much better than I do, so if you've got things to add, please do! = )
The Bitcoin Utopia project handed out an enormous amount of credit.
Thanks @jimbo, I think this is a very important driver. The credit growth of Bitcoin Utopia matches the steep increase of overall credit nicely.
Good point!
Trend lines! Channels! Does TA maybe apply here?
Also some projects, like citizen science grid, give way too much credit compared to other projects for completing wu's to form any good compare.