Global warming - data measurement and projected impacts through to Year 2100
Following on from yesterday's sobering post that says that evidence for man-made global warming has now hit a "gold standard" (based on three independent sets of satellite data collected over 40 years), let's be a bit cheerier and take a look at atmospheric carbon dioxide.
It's going up. Fast. Too fast. And yes, that's bad. Today I'll touch on how global atmospheric carbon dioxide is measured, how it correlates to global temperature rise over time, what the scenarios are for reducing our rate of warming and the impacts scientists predict by degree of temperature rise through to the Year 2100.
Phew. Let's get started - in Hawaii.
Where is atmospheric carbon dioxide measured?
Skeptical Science tells us that CO2 levels are measured at hundreds of stations across 66 countries.
According to Wikipedia,
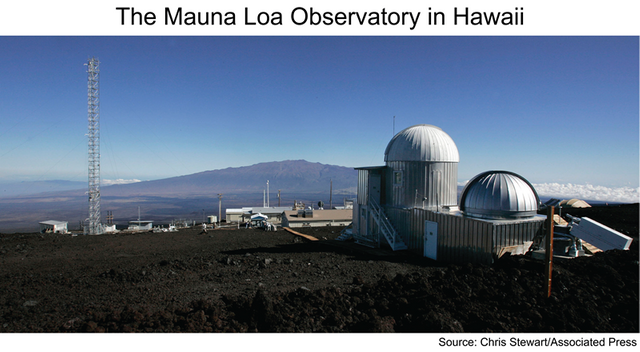
The first reproducibly accurate measurements of atmospheric CO2 were from flask sample measurements made by Dave Keeling at Caltech in the 1950s. A few years later in March 1958 the first ongoing measurements were started by Keeling at Mauna Loa. Measurements at Mauna Loa have been ongoing since then. Now measurements are made at many sites globally. Additional measurement techniques are also used as well. Many measurement sites are part of larger global networks. Global network data are often made publicly available on the conditions of proper acknowledgment according to the respective data user policies.
And here's what the Keeling Curve is telling us (you can download historical data sets for free here). We passed the 350 ppm benchmark in around May 1986, and cracked the scary 400 ppm mark in February 2015, if I'm reading the data correctly.
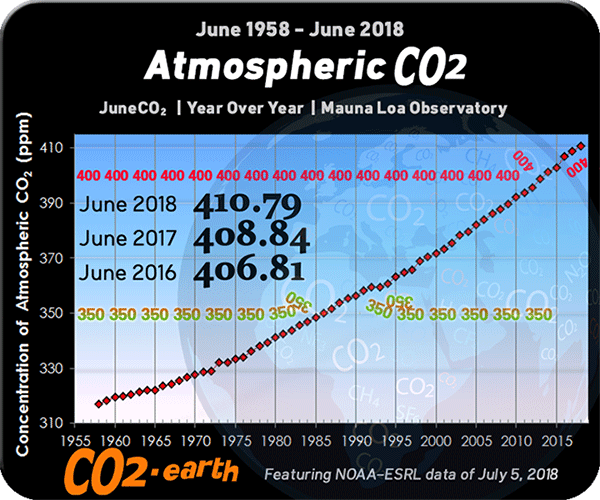
The CO2.earth website is a wealth of resources, and gives good background to the data:
The direction of atmospheric CO2 has been constant for decades. Year after year since 1958 when Charles David Keeling started measurements at the Mauna Loa Observatory in Hawaii, earth's background CO2 level has only gone up. Overall, the increases have been accelerating.
The Mauna Loa Observatory is home to two independent CO2 monitoring programs:
April 1974 - Present Global Monitoring Division | National Oceanic and Atmospheric Administration (NOAA) Earth System Research Laboratory (ESRL)
1958 - Present Scripps CO2 Program | Scripps Institution of Oceanography (SIO) at the University of California San Diego (UCSD)
NOAA operates the Mauna Loa facility.
Whoa - what's this ppm stuff?
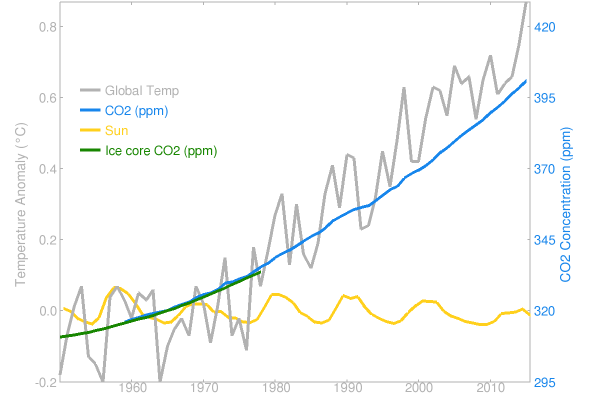
Atmospheric carbon dioxide is measured in parts per million (ppm) and is correlated with global increase in temperatures. There's a good explanation for what ppm means here:
When measuring gases like carbon dioxide, oxygen, or methane, the term concentration is used to describe the amount of gas by volume in the air. The 2 most common units of measurement are parts-per-million, and percent concentration.
Parts-per-million (abbreviated ppm) is the ratio of one gas to another. For example, 1,000ppm of CO2 means that if you could count a million gas molecules, 1,000 of them would be of carbon dioxide and 999,000 molecules would be some other gases.
Sure - and this relates to global warming how exactly?
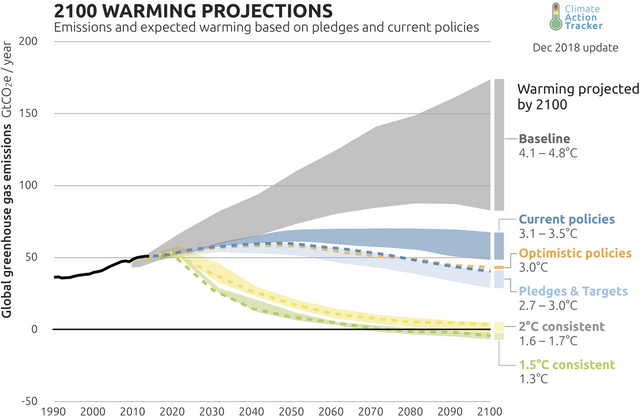
That's barely 1 degree Celsius, you say. Have a look at these recent long term projections through to the year 2100 and prepare to be sobered. If we were to allow the Earth to warm by 5 degrees Celsius, we wouldn't recognise our planet.
What would the impact be of an up to 4.5 degree Celsius rise in global temperature?
This comprehensive paper put together by CarbonBrief based on data extracted from 70 peer-reviewed climate studies shows the expected impacts of climate change at 1.5 degrees Celsius up to 4.5 degrees Celsius on the following categories of things near and dear to humans on Earth:
- oceans
- ice
- temperature
- rainfall
- drought
- storms and flooding
- crops
- nature
- economy
- health
And this paper summarises the potential impact by degree of global temperature increase, acknowledging there are many other impacts which are difficult to quantify:
In general, each degree C of
global temperature increase
can be expected to produce:
• 5-10% changes in precipitation
across many regions
• 3-10% increases in the amount
of rain falling during the heaviest
precipitation events
• 5-10% changes in streamflow
across many river basins
• 15% decreases in the annually
averaged extent of sea ice across
the Arctic Ocean, with 25%
decreases in the yearly minimum
extent in September
• 5-15% reductions in the yields
of crops as currently grown
• 200-400% increases in the area
burned by wildfire in parts of the
western United States
Cheery news, eh?
References
https://www.skepticalscience.com/co2-measurements-uncertainty.htm
https://en.wikipedia.org/wiki/Carbon_dioxide_in_Earth%27s_atmosphere#Ongoing_measurements_of_atmospheric_CO2
http://blogs.discovermagazine.com/imageo/2018/06/08/carbon-dioxide-reached-the-highest-levels-ever-directly-measured/#.XHbMpIgzY2w
https://www.co2.earth
https://www.co2.earth/co2-monitoring
https://theconversation.com/how-is-atmospheric-co2-measured-in-the-southern-hemisphere-14219
https://www.co2meter.com/blogs/news/15164297-co2-gas-concentration-defined
http://www.realclimate.org/index.php/page/2/?s=rahmstorf
https://climateactiontracker.org/global/temperatures/
https://interactive.carbonbrief.org/impacts-climate-change-one-point-five-degrees-two-degrees/
@kiligirl You have received a 100% upvote from @intro.bot because this post did not use any bidbots and you have not used bidbots in the last 30 days!
Upvoting this comment will help keep this service running.
Congratulations @kiligirl! You have completed the following achievement on the Steem blockchain and have been rewarded with new badge(s) :
Click here to view your Board
If you no longer want to receive notifications, reply to this comment with the word
STOPTo support your work, I also upvoted your post!
Do not miss the last post from @steemitboard:
Thank you, @steemitboard.