Leaflet Mapping in RStudio - Custom Popups
Introduction
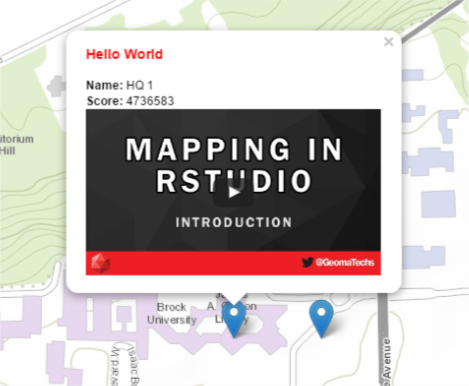
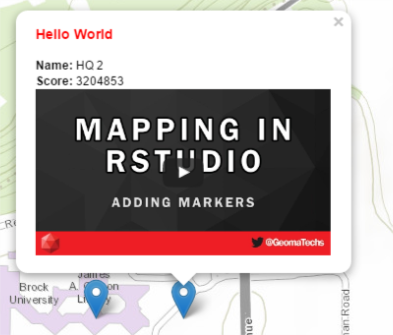
Here is the final script from the end of the tutorial video above. Following this will be a demonstration of including hyperlinks in your popup windows.
# load leaflet library
library(leaflet)

# Set up your data frame
data <- data.frame(c(43.11940,43.11940),
                   c(-79.24658,-79.244658),
                   c("HQ 1","HQ 2"),
                   c(4736583,3204853),
                   c('<iframe width="300" height="169" src="https://www.youtube.com/embed/vl9D3uTk36k?showinfo=0" frameborder="0" allowfullscreen></iframe>',
                     '<iframe width="300" height="169" src="https://www.youtube.com/embed/dBk8gGX1MNk?showinfo=0" frameborder="0" allowfullscreen></iframe>'))

# give names to your data columns
names(data) <- c("lat","lng","name","score","video")

# create the leaflet map variable
m <- leaflet() %>%
  addProviderTiles("Esri.WorldTopoMap") %>%
  addMarkers(data=data,
  lat=~lat,
  lng=~lng,
  popup= ~paste("<h3 style='color: red'>Hello World</h3>","<b>Name:</b>",name,"<br>","<b>Score:</b>",score, video, sep=" ")
            )

# print map
m
Adding Hyperlinks
There are plenty of ways to go about doing this in the leaflet package, but I will outline two here.
- A single static link for in all popup windows
- Creating dynamic variables to use for seperate links in each popup window.
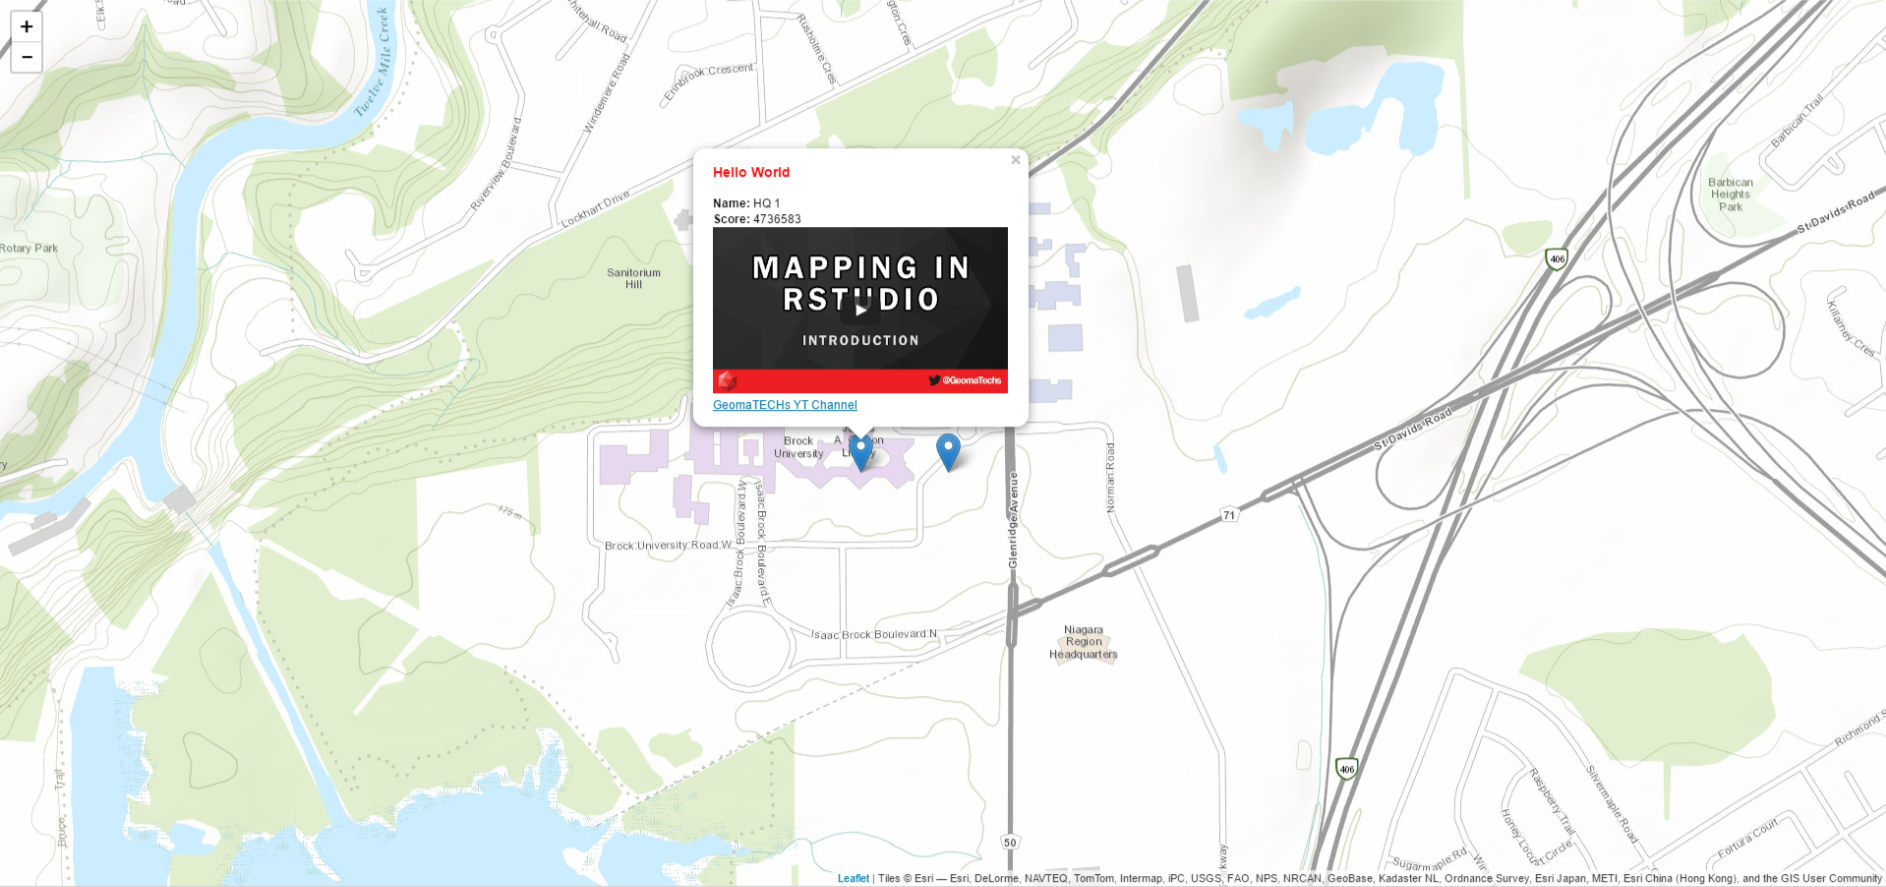
Option 1
- Here we will simply add a new line to the paste function in the origional script above. HTML links can br written using the following notation:
<a href="url">link text</a> - To impliment this into the
paste()function inRwe will use a link to the GeomaTECHs YouTube channel: https://www.youtube.com/channel/UCTalI0S14Ek6DcvvvFIFPOg.
# create the leaflet map variable
m <- leaflet() %>%
  addProviderTiles("Esri.WorldTopoMap") %>%
  addMarkers(data=data,
  lat=~lat,
  lng=~lng,
  popup= ~paste("<h3 style='color: red'>Hello World</h3>","<b>Name:</b>",name,"<br>","<b>Score:</b>",score, video,
  "<br>","<b>Link:</b>","<a href='https://www.youtube.com/channel/UCTalI0S14Ek6DcvvvFIFPOg'>GeomaTECHs YT Channel</a>",sep=" ")
            )

# print map
m
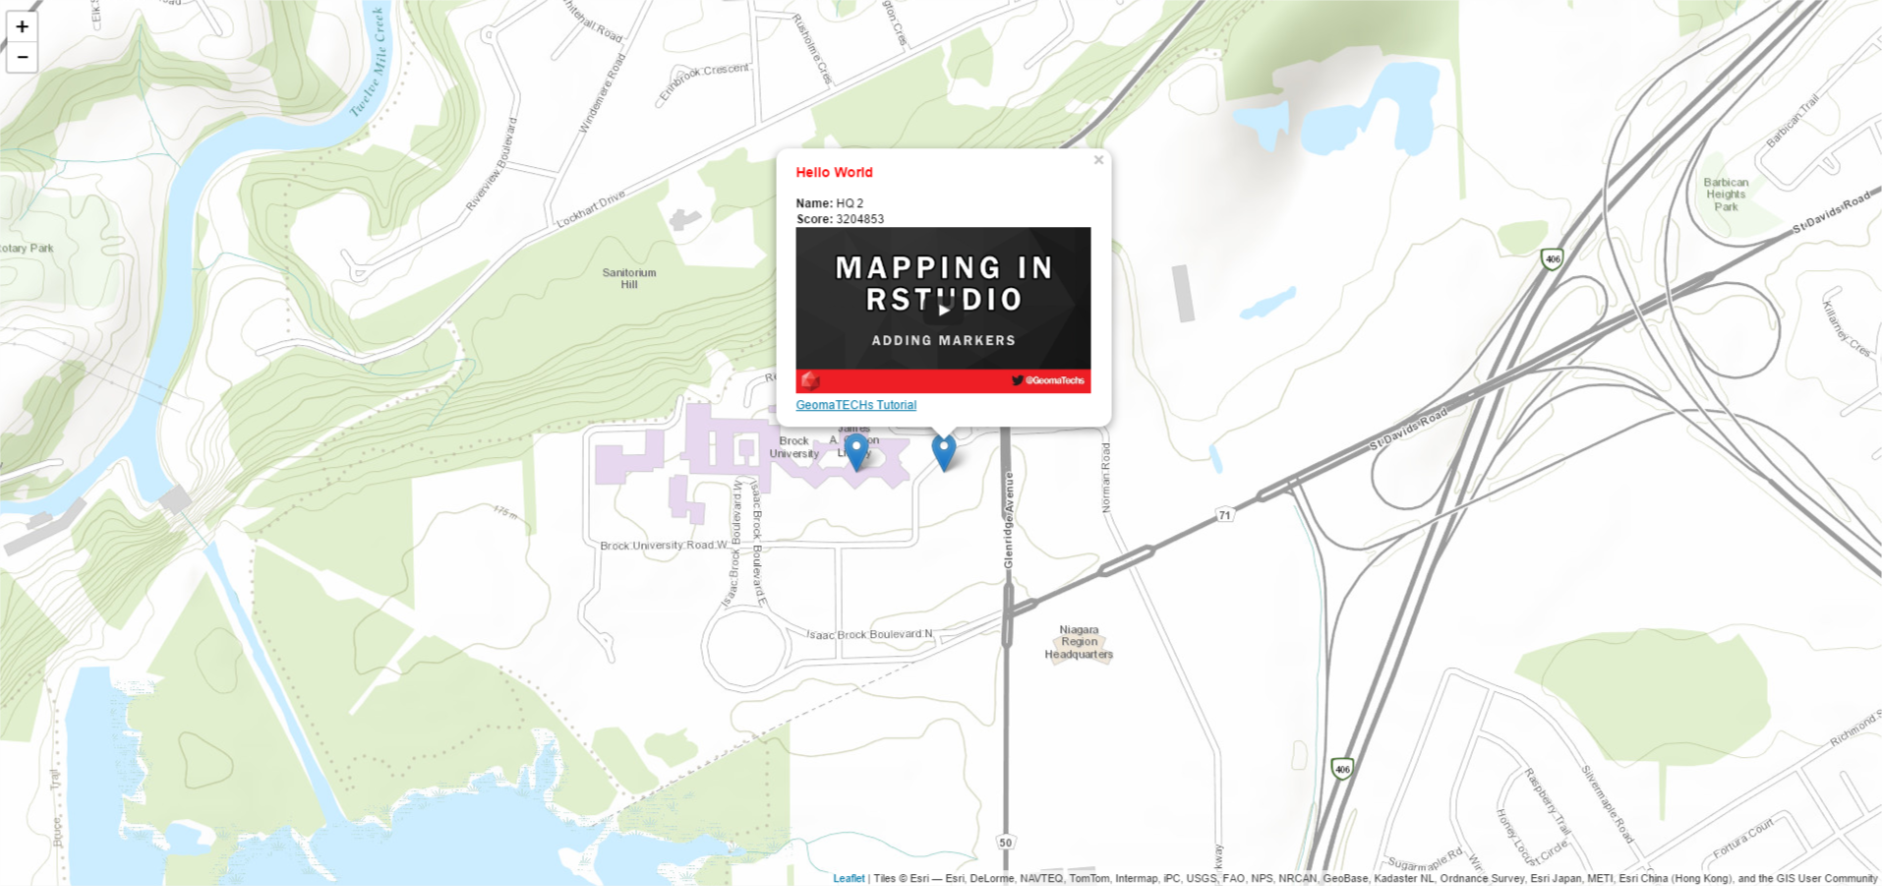
Option 2
- In this option we will add a different hyperlink to each popup by adding the links into the
datavariable that was created.First create a list of the links you would like to add to your data frame. This step will only need to be done if you are creating your data from scratch or if you need to combine an existing dataset with a set of hyperlinks. If it is the latter, then be sure the list of hyperlinks is as long as the length of the columns in your origional data or you may have problems.
Okay lets create the list of hyperlinks:
# create list of links in a variable
links.list <- c("<a href='https://www.youtube.com/channel/UCTalI0S14Ek6DcvvvFIFPOg'>GeomaTECHs YT Channel</a>",
                "<a href='https://www.youtube.com/watch?v=vl9D3uTk36k'>GeomaTECHs Tutorial</a>")
Now we can add a
linkcolummn to ourdatavariable using thedata$link.data$link <- links.listThe final step is to add the variable
linkto thepaste()function. In this example I have placed the link under the YouTube videos.# create the leaflet map variable m <- leaflet() %>% addProviderTiles("Esri.WorldTopoMap") %>% addMarkers( data=data, lat=~lat, lng=~lng, popup= ~paste("<h3 style='color: red'>Hello World</h3>","<b>Name:</b>",name,"<br>","<b>Score:</b>",score, video,link,sep=" ") ) # print the map m
Conclusion
For every tutorial video on YouTube I will try and use this Steemit account to expand on any complicated questions that viewers may have. As more questions come in I will add information to these documents hopefully answering them. So be sure to keep checking back for new information.
Your tutorials are very easy to follow and it is interesting to see how to run Leaflet in a different way. I learned it with javascript and never realized it could be used like this.
You would probably get more views and upvotes if you changed some of your category tags. Coding is the only one that other people might see, the rest aren't really being used right now. I put GIS in my last post to encourage its use, but as a new member you might want to try categories like steemstem statistics maps and programming to get more exposure and find other like-minded users. Properly referencing sources and linking to the software will also help you. It takes a little html to make it look nice, but you seem pretty good at coding! Keep up the good work!
Thank you @gra !
I too learned web-based GIS on javascript (mostly google maps API) but fell into the world of R as I began graduate school. I find that there are many students and researchers who understand R due to their need for statistics computation but they aren't aware of how to present their findings in a spatial context.
ps - thanks for the typo correction!
Interesting...statistics can say a lot on their own, but visualizing that data spatially makes it easier to identify trends that the numbers might not show. I am excited to see how you apply this to your research!
This post received a 82% upvote from @morwhale team thanks to @gra! For more information, click here! . this is @originalworks . steem @steemprice BTC
The @OriginalWorks bot has determined this post by @thornux to be original material and upvoted it!
To call @OriginalWorks, simply reply to any post with @originalworks or !originalworks in your message!
To enter this post into the daily RESTEEM contest, upvote this comment! The user with the most upvotes on their @OriginalWorks comment will win!
For more information, Click Here!
Special thanks to @reggaemuffin for being a supporter! Vote him as a witness to help make Steemit a better place!
$4929.37 USD/BTCVolume: 81197.87 BTC ($400254006.18 USD)Last Updated Tue Oct 10 18:31:02 2017Congratulations @thornux! You have completed some achievement on Steemit and have been rewarded with new badge(s) :
Click on any badge to view your own Board of Honor on SteemitBoard.
For more information about SteemitBoard, click here
If you no longer want to receive notifications, reply to this comment with the word
STOPThis post has received a 3.13 % upvote from @drotto thanks to: @gra.
@originalworks
@originalworks
You do a great job. @gra Have a nice day! :)
Thank you @hdmed ! I appreciate the support :)