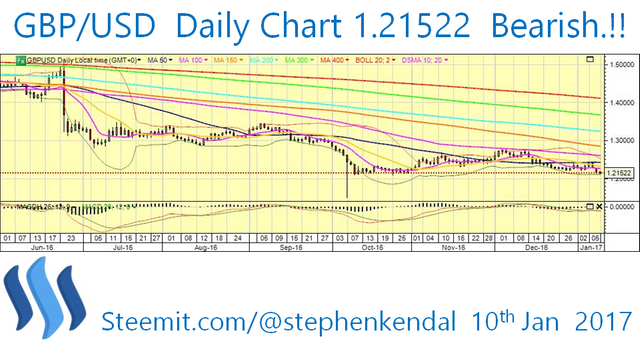
Pound continues to plummet. GBP/USD Daily Chart 1.21522. Bearish.!!
GBP/USD
Interesting article in the fxstreet and all credit to fxstreet for the content.
I thought I would share it with you.
The Pound Sterling remains Bearish against the US Dollar as it is continually drawn towards the lows of 1.05 not seen since 1985..!!
Outlook - BEARISH ..!!
Thanks for reading.
Stephen
We've still yet to actually even trigger article 50, I'm willing to bet that when it's triggered there will be a slump in GBP's value and again when we end up with a hard brexit.
At least crypto assets will be worth more.. hah!
This is where the smart money is piling into..!! #Silver. Fiat Currencies are all doomed now. Stephen
Always bothers me when language gets changed to become emotive. What FXStreet said was
No mention of the word plummet. What it does say is GBP went down against USD even though other currencies had gone up and laid the blame on words from the British PM.
The article did prompt me to dig into the charts to let the data do the talking - GBPUSD Daily since just before Brexit.
The bottom Yellow line is all time low since 1994 measured on a monthly chart which was touched again in October 2016. This is a strong level. There are two downtrend lines - the green one comes from the weekly. It is still intact - so the currency is firmly in downtrend. The red one comes from the daily and is taken from the last reversal before Brexit and has several touches. Price broke through that in late November (earlier if you draw a trend line from the high at Brexit) - indicating the start of an uptrend. Since October price has been in a sideways channel painted in purple and has just made the 3rd touch on the bottom side. So there are three levels of resistance - the bottom of the purple channel, the bottom yellow line and the top of the red downtrend line
Now some clues about where it might go. Bad news is there are two.
We will know in a week or two. Meanwhile we have to look at fundamentals. FTSE 100 made a new high - money will come in to invest in that. UK interest rates are rising faster than US or Europe - money will come in for that depending on views on credit quality of UK gilts.
As a trader I will look to go long when I see strong price action between the purple channel and the bottom yellow line. I will go short when it breaks below and retests
Plummet was my word not theirs. It was not referenced to the article. I thought their article simply enhanced what I was saying. I am saying it is plummeting not them. Hope this helps. GBPUSD is clearly heading to 1.05. Thanks for the comment I appreciate it. Stephen
Great for exporters though Stephen! Has been at these levels back in October, if it breaks down agree could go a lot lower
I agree, great for exports, but bananas are about to go through the roof..!! ;) Stephen
This post has been ranked within the top 80 most undervalued posts in the second half of Jan 10. We estimate that this post is undervalued by $5.77 as compared to a scenario in which every voter had an equal say.
See the full rankings and details in The Daily Tribune: Jan 10 - Part II. You can also read about some of our methodology, data analysis and technical details in our initial post.
If you are the author and would prefer not to receive these comments, simply reply "Stop" to this comment.