RE: Pound continues to plummet. GBP/USD Daily Chart 1.21522. Bearish.!!
Always bothers me when language gets changed to become emotive. What FXStreet said was
GBP/USD Forecast: Bearish bias remains despite of broad based USD retracement
No mention of the word plummet. What it does say is GBP went down against USD even though other currencies had gone up and laid the blame on words from the British PM.
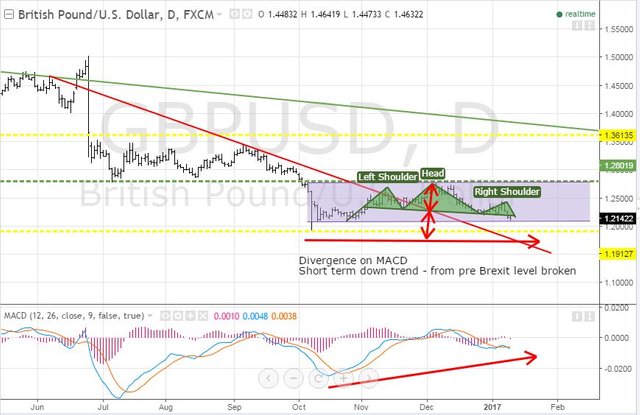
The article did prompt me to dig into the charts to let the data do the talking - GBPUSD Daily since just before Brexit.

The bottom Yellow line is all time low since 1994 measured on a monthly chart which was touched again in October 2016. This is a strong level. There are two downtrend lines - the green one comes from the weekly. It is still intact - so the currency is firmly in downtrend. The red one comes from the daily and is taken from the last reversal before Brexit and has several touches. Price broke through that in late November (earlier if you draw a trend line from the high at Brexit) - indicating the start of an uptrend. Since October price has been in a sideways channel painted in purple and has just made the 3rd touch on the bottom side. So there are three levels of resistance - the bottom of the purple channel, the bottom yellow line and the top of the red downtrend line
Now some clues about where it might go. Bad news is there are two.
- The momentum indicator below the chart is MACD. It has made higher lows at the time that price has made level lows. This is a sign of bullish divergence - i.e., downward momentum has slowed and price could break upwards (marked by the two single headed red arrows).
- The green pattern is a head and shoulders. Price made a high and pulled back (left shoulder). It then made a higher high and pulled back (head). Last price action made a lower high and pulled back completing right shoulder. This pattern normally happens at the top of a cycle but in this case it could indicate that the power of the up move is too weak and it will fall over. Normally what happens is the move goes as far as the height of the head to the neckline indicated by the two red - double sided arrows. If this holds true, price will go below the monthly resistance line - and into the blue sky below that.
We will know in a week or two. Meanwhile we have to look at fundamentals. FTSE 100 made a new high - money will come in to invest in that. UK interest rates are rising faster than US or Europe - money will come in for that depending on views on credit quality of UK gilts.
As a trader I will look to go long when I see strong price action between the purple channel and the bottom yellow line. I will go short when it breaks below and retests
Plummet was my word not theirs. It was not referenced to the article. I thought their article simply enhanced what I was saying. I am saying it is plummeting not them. Hope this helps. GBPUSD is clearly heading to 1.05. Thanks for the comment I appreciate it. Stephen